RAPIDLY
DEVELOPING THUNDERSTORM - Convection Warning (PGE19 V4.0)
v2016
- Improvement from previous version
- Goal of the RDT product
- RDT Algorithm & characteristics
- The detection of cloud systems
- The tracking of cloud systems
- The discrimination of convective objects
- Forecasting cloud systems
- Additional attributes
- The output products
- Example of visualization
- Visualization of additional attributes
- A
case study
- An extended application
- The configuration file
- The Documentation
Improvement
from previous version
(v2013 to v2016)
- PGE19 (GEO-RDT-CW) is a continuation of CDOP-PGE11 (RDT). The
main changes implemented in v2016 concern:
- Adaptation to new v2016 NWCLIB interfaces and structures
- More optional inputs: new CMIC product for microphysics, HRW for movement analysis, NWP wind component as additional inputs for NWP parameters.
- Processing of a 2D movement field as guess field (from HRW and NWP winds) for initialization of cloud cell motion
- Improvement of spatial and temporal coherence of cloud cell motion, improvement of expansion rate processing
- Additional attributes related to CMIC
product (phase, microphysics parameters), basic related icing index at
high altitude, lightning trend, top
pressure trend, synthetic
multisource severity index - Improvement of discrimination modules that change a "No" convection diagnosis issued from statistical discrimination step of algorithm (for example in case of OT detection or, according to user’s configuration, lightning activity or high CRR). Product keeps memory of “forced” convection diagnosis too, and this characteristic is taken into account in the next slots. Improvement of the de-classification step.
- Optional parallax correction inserted before product encoding
- The compliance with NetCDF format for encoding SAFNWC v2016 outputs (BUFR output may additionally be produced for non regression purposes, depending on user’s configuration). NetCDF encoding refers to bulletin-like structure, but optional 2D map of type/phase of convective cells may be available into the output of analyzed cloud cells, depending on user’s configuration.
- The
development of a nowcast (+1h)
module (Convection Warning module), activated through user’s
configuration, and leading to maximum four forecast products (+15’,
+30’, +45’, +60')
Goal
of the RDT-CW product
The
RDT-CW (Rapid Development Thunderstorm) product has been developed by
Meteo-France
in the framework of the EUMETSAT SAF in support to Nowcasting. Using
mainly
geostationnary satellite data, it provides information on clouds
related to
significant convective systems, from meso-alpha scale (200 to
2000 km) down to
smaller scales (few pixels). It is provided to users in the form of
list of numerical data
stored in an output file. The objectives of RDT-CW are :
- The identification, monitoring and tracking of intense
convective system clouds
- The detection of rapidly developing convective cells
- The forecast of the convective cells
Thereby, RDT is a tool for forecaster but can be used by research teams, and end-users like aeronautical users.
RDT-CW Algorithm
The
RDT process includes four steps:- The
detection of cloud systems
- The
tracking of cloud systems
- The discrimination of convective cloud objects
- The advection of
convective cloud objects
The
detection of cloud systems
The
detection algorithm allows to define “cells” which represent the cloud
systems.
In the RDT-CW algorithm, “cells” are defined on infrared images
(channel
IR10.8) by applying a threshold which is specific to each cloud system,
depending on local brightness temperature pattern. But a pre-processing
is included prior to this step:Processing mask :
- Since v2009, RDT-CW may take advantage of Cloud Type as optional input, to ignore cloud-free areas in the identification of cloud cells. Even if the impact on CPU is weak, it forces RDT-CW to focus on cloudy areas only. CT is used rather than CMa to take benefit also from Cloud Type information and save a double file reading.
- Since v2010, RDT-CW takes into account the deformation of pixels when on the edge of the spaceview domain. A mask of stretched pixels (pixels more than 5 * nominal_area) is automatically elaborated and backuped, and masked zones are ignored in the detection step, where gradients processing (used as predictor in discrimination scheme) should be less reliable.
- Both approaches are merged before the detection step to focus on areas of interest
 CT product |
 Non cloudy pixels identification |
 mask for stretched pixels (backup file) |
 stretched
pixels + non
cloudy pixels stretched
pixels + non
cloudy pixels |
 IR10.8 image |
 Working image for detection step |
Cells identification :
- In the case of simple
topography (like the simple, isolated, cloud associated to a single
convective cell in clear air, at development stage), the chosen
threshold corresponds to the outer limits of the cloudy zone
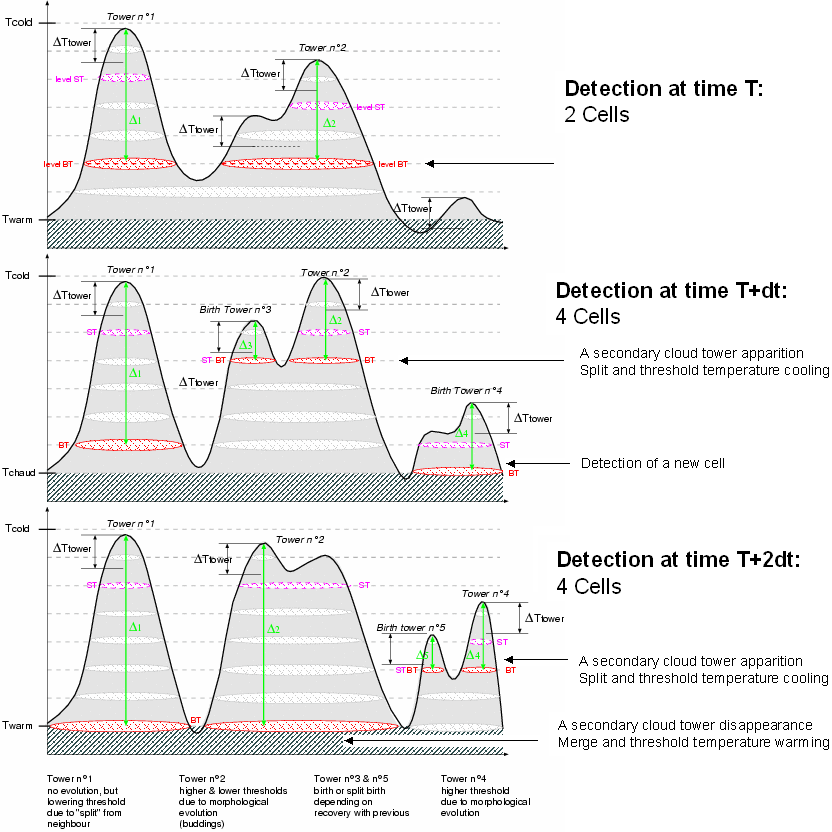
- In other cases,
the principle is to use the warmest temperature threshold which allows
to get one cell for each significant cloud "tower". A cloud tower is
here formally
defined as a local brightness temperature minima which is separated
from the other, nearby, minimas by a sufficiently warmer zone (6degC
warmer)
Thus, the RDT-CW cells linked in time to form a trajectory do not necessarily really depict along time the phenomena at the same threshold temperature. But the advantage of the method used (adaptative threshold) is to focus on convective parts of the cloud systems, in order to perform the discrimination process (see below).
In order to increase the relevancy of the cloud contour corresponding to a given threshold, the vertical gradient of contour surface is taken into account for a definitive choice of representative level (base of cloud tower level). It is applied when the vertical morphology of the cloud presents particular shapes, with cloud systems defined by only one tower, and when the chosen representative threshold, automatically set to the warmest value, leads to a bottom contour much larger than the horizontal extension of the top tower itself in its coldest part. Moreover, as detailled later below, a secondary contour, more representative of the top of tower, may complement the cloud system representation.
The tracking of cloud systems
The choice of an adaptative threshold algorithm makes complex the cell comparability due to various phenomena depicted. This method also induces numerous merge and split.The tracking algorithm is mainly built on the overlapping between cells in two successive images. Before the cells overlap processing, the previous cells are moved according to their (formerly analyzed) move and speed. Nevertheless, correlation or neighboorhood methods are applied when overlapping method doesn't succeed. Moreover, a guess movement field is taken into account through NWP and HRW data for triggering cells without any link with previous cells.
Then, the temporal links are processed as follow:
- No match : the current cell is a new one and begins a new trajectory
- Merge : more than one former cell match with one current cell. A main temporal link is established with one of the "largest" former cell (continued trajectory) ; the other ones, corresponding to ended trajectories, as considered as secondary temporal links . Due to adaptative threshold temperature use, the largest former cell is not directly defined on its area attribute but on a area defined at a common threshold.
- Split : One former cell match with several current cells. Here again, a main temporal link is established with one of the "largest" current cell for the continued trajectory. The other current cells begin new trajectories.
- Merge and split : Several former cells match witch several current cells: In this case (less than 3% of trajectories), all trajectories are closed and the current cells are processed like new cells.
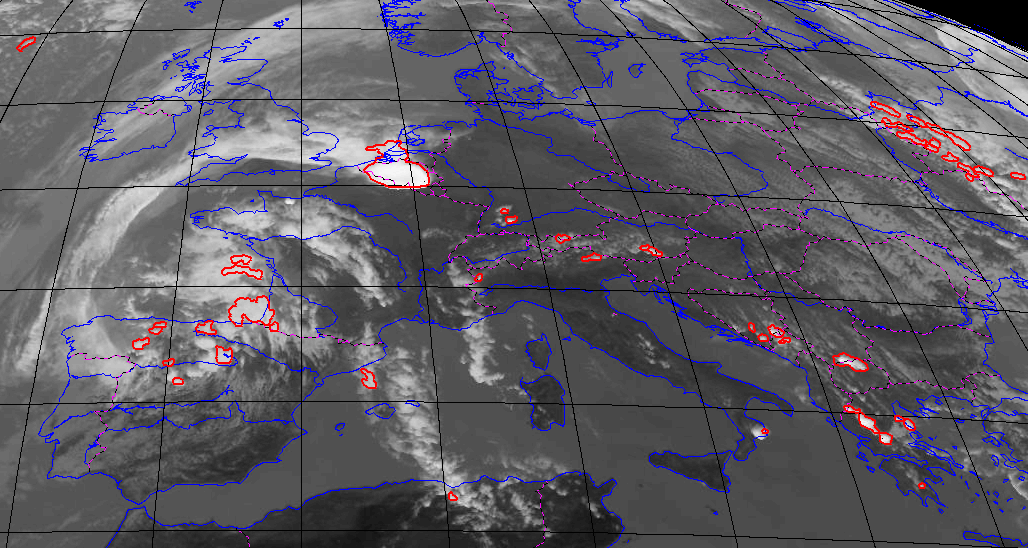
The discrimination of convective objects
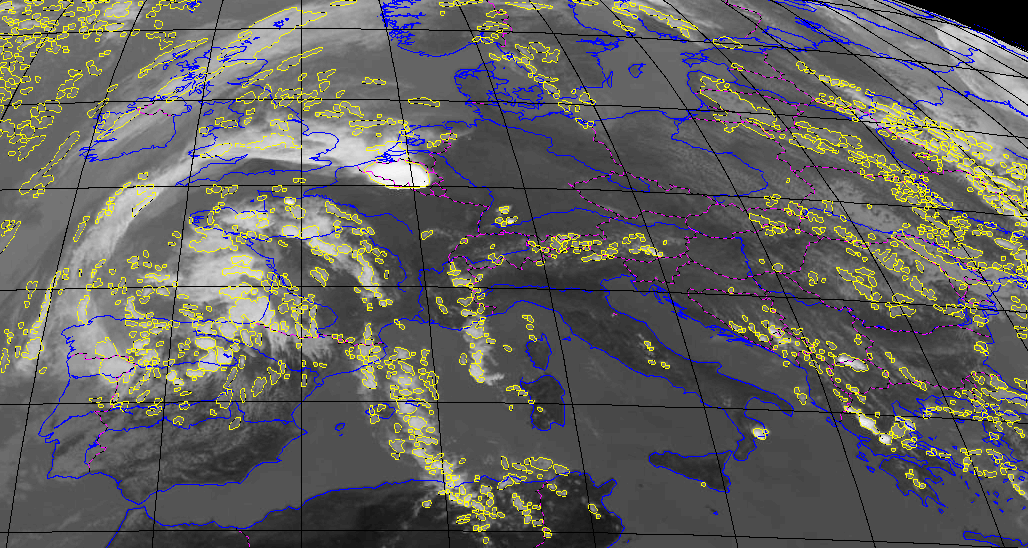
As was mentioned previously, the RDT-CW detection algorithm is able to detect cloud structure from meso-alpha scale down to pixel scale. The goal of the discrimination method is to identify the convective RDT-CW objects among all cloud cells, adding a strong constraint which is that the discrimination should be effective as soon as possible after the first detection by RDT-CW software.The left picture below displays all RDT-CW detected cells. It points out the detection and tracking efficiency of RDT-CW. We can notice the phenomena and scale diversity of RDT-CW objects.
The right image displays convective objects only. The ratio between no convective and convective objects is about 100.
The discrimination method makes use of discrimination parameters calculated from five MSG channels: IR 10.8µm, IR 8.7µm, IR 12.0µm, WV 6.2µm and WV 7.3µm.
Two kinds of discrimination parameters are computed:
- Spatial characteristics (peripheral gradient, surface...)
- Temporal characteristics (rate, extremum on various past period )
- This convective characteristic is inherited as long as the cloud system is developping as expected
- Empirical rules apply after a given period, to check , confirm or
declassify the convective characteristic of the cloud systems
The discrimination scheme has then been validated over a large Europe domain using the ground truth from the extended EUCLID lightning network.
Since v2011 , NWP data is used for a guidance of discrimination scheme when available
- Convective indexes are computed from NWP to produce a convective
/ non convective mask to identify non convective areas
- Only cloud cells out of non convective areas are submitted to discrimination scheme
- LI (Lifted Index) and gap to tropopause may be used as extra predictors for discrimination scheme
NWP mask : 0 = non convective areas = union of 3 non convective indexes
The discrimination scheme is described into ATBD document.
Forecasting
convective cloud systems
Convective cells have their own dynamic
and can have a trajectory that does not always follow the
environmental displacement fields. The object mode of RDT-CW analyses
the motion of each cell, and computes this speed. Speed estimate has
previously been improved for orphan and triggering cells through
movement guess
field. This guess field is derived
from current HRW winds when available, or in a lower extend from NWP
winds. A temporal coherence checking has been added to reduce
variability of speed estimate.
The forecast scheme
uses this speed estimate to forecast the successive position of each
cell. The Lagrangian method is proved to be
quite efficient up to 1 hour range. Thus the forecast is proposed
up to this limit. This leads, for MSG FDSS (15min update rate),
to an independant product for each lead range (+15', +30, +45 and
+60'). Corresponding products constitute the Convection-Warning part of
RDT-CW.
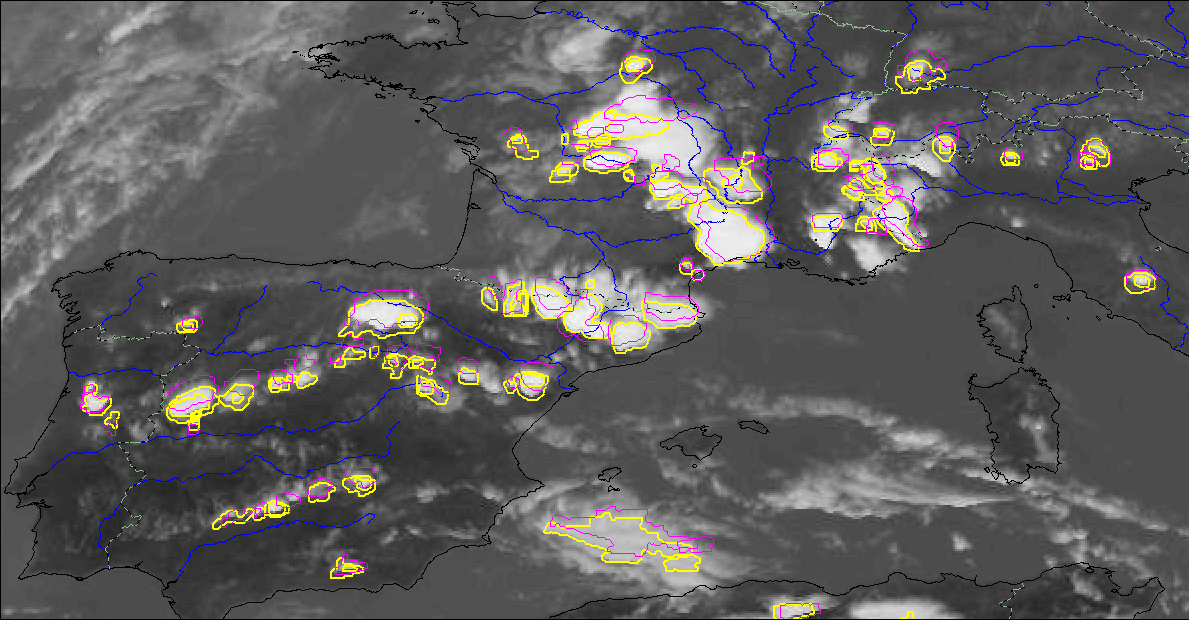
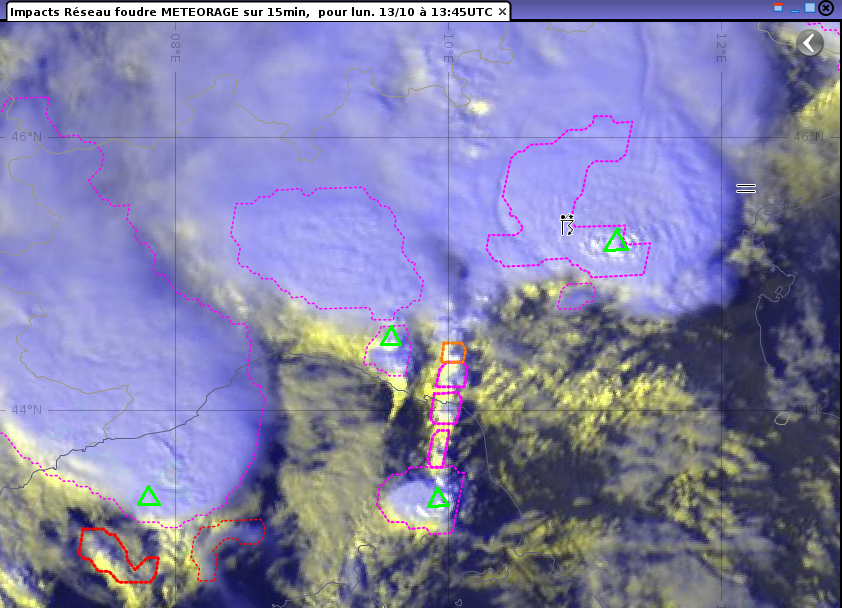
Analyzed (yellow contours) and 60min-forecast (magenta contours) RDT-CW
cells
External
attributes of convective
objects, and 3D description
- RDT-CW is able to take into account lightning strokes location. This optional additionnal data may also allow to improve discrimination skill, if requested. The object approach of RDT-CW algorithm allows to characterize the lighning activity associated to a convective cloud object and to build its time serie. It is to note that the temporal shift between satellite data and flash impact is taken into account.
- RDT-CW can take advantage of cloud top pressure information as additional attribute, when CTTH is requested as additional optional data
- minimum value of pressure over cloud cell extension is
estimated to qualify the most representative and relevant value of
cloud top
- RDT-CW can take advantage of cloud type and cloud microphysics information as additional attribute, when CT and CMIC are requested as additional optional data
- Type of cloud of each pixel of cloud cell is collected and the highest proportion is estimated
- Phase information of each pixel of cloud cell is collected and the highest proportion is estimated, to qualify the cloud cell phase as water / ice / mixed
- maximum values of each COT, Reff and CWP=LWP+IWP are identified
when available. Those parameters may be linked to a beta-index related
to High Altitude Icing Hazard
- RDT-CW can take advantage of CRR data as optional input, for additional attribute, when PGE05 is requested as additional optional data
- CRR data are used to identify maximum convective rain rate over
cloud cell extension
- High CRR data may be used additionally to qualify a cloud cell
as significant and to encode this cell in BUFR output (for the last
BUFR version only)
- Very High CRR data may be used on request to force convective
diagnostic
- Depending on cloud morphology, a “second
information level”
may be
encoded for some cells. Practically, these cells are
encoded as additional cells whose contour corresponds to “top of tower”
(6degC warmer than minimum temperature). They are linked to the main
“tower-base” level through Identification number. They get their own
attributes, estimated over their own horizontal extension.
- Overshooting Top Detection (OTD) is attempted for each cloud satisfying some criteria
- Static and morphological analysis of cloud cell allows a pre-detection of OT candidates
- Stricter and additional criteria, added with NWP tropopause,
allow a confirmation of the relevant OT
The output products
The final products concerning RDT-CW are- Current living cloud
cells : numerical data which depict infrared characteristics
(spatial and time)
and move
information associated to RDT-CW cells. Numerical data are provided in
a bulletin-like NetCDF
format. Depending on user's configuration, it may also content a map of cloud cells, whose numerical
values correspond to the
phase of development of each cloud system.
- Forecast cloud cells
: numerical data provided in
a bulletin-like NetCDF
format, focusing on localization and a
limited set of attributes for the next
15, 30, 45 or 60min (one product for each forecast range)
- Achieved cloud
trajectories : all the life of a cloud system is described once
completed, from its triggering phase to its dissipation. This
information is encoded in ASCII
format.
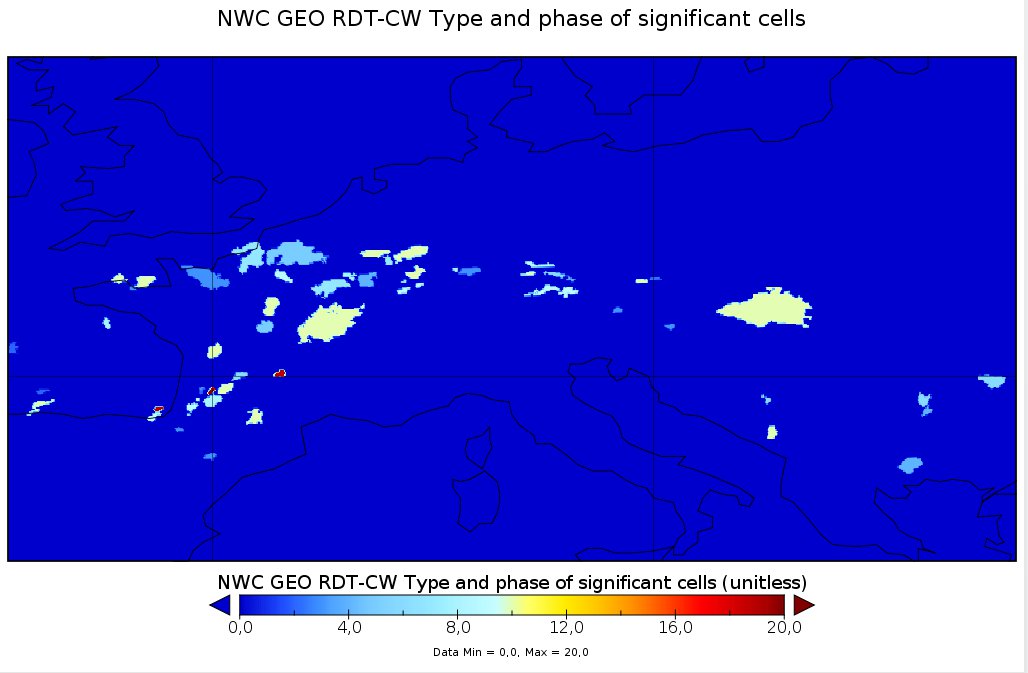
Example of RDT-CW analyzed map. For a correspondance between encoded values and Cloud type and phase, see DOF documentation
Optimal Visualization the RDT-CW should need development of a dedicated post-processing, depending on given specifications : access to current cell's localizations and attributes, or access to the recent current trajectories (with historical past series) from a single RDT-CW product, or to the whole trajectory through a serie of RDT-CW products, the latter case implying to manage the temporal links between cloud cells
The Current Object-Netcdf and Trajectory-ASCII formats are described in the Document Output Format (DOF) of SAFNWC. Trajectory file is produced only on user's request (see configuration file).
For non-regression purposes, RDT-CW may still offer the possibility to encode RDT in BUFR format (preferentially the latest fourth version including OTD characteristics). But Netcdf output offers more flexible possibilities to display the product.
Example
of visualization
=>RDT-CW may be visualized at Meteo-France on several platforms:- a prototype for intranet / internet browsers
- SYNERGIE Meteo_France forecaster tool
- SYNOPSIS new Meteo_France forecaster tool
Those tools usually combine RDT-CW product and MSG satellite data (either infra-red, visible or RGB), and rely three levels of visualization :
- The localization corresponds to the superposition of graphical attributes on the corresponding infrared image. These graphical attributes are:
- A colored contour which defines cloud system edge. The color of this(those) contour(s) is usually related to the life-cycle stage of the system
| yellow => triggering = warmest categories, i.e. minimum temperature > -25degC |
| red => growing = minimum temperature > -40degC |
| magenta => mature categories, i.e. minimum temperature <= -40deg |
| orange => split cases (inherited convective diagnostic) |
- A line (blue in the image below) shows the trajectory of the system (all previous locations of the centre of gravity of the system in past images).
- An arrow (magenta in the image below) shows the expected move of the gravity center of the system for the next hour.
- A symbol
(green
diamond or triangle) identifies an overshooting top detection (OTD)
when it occurs
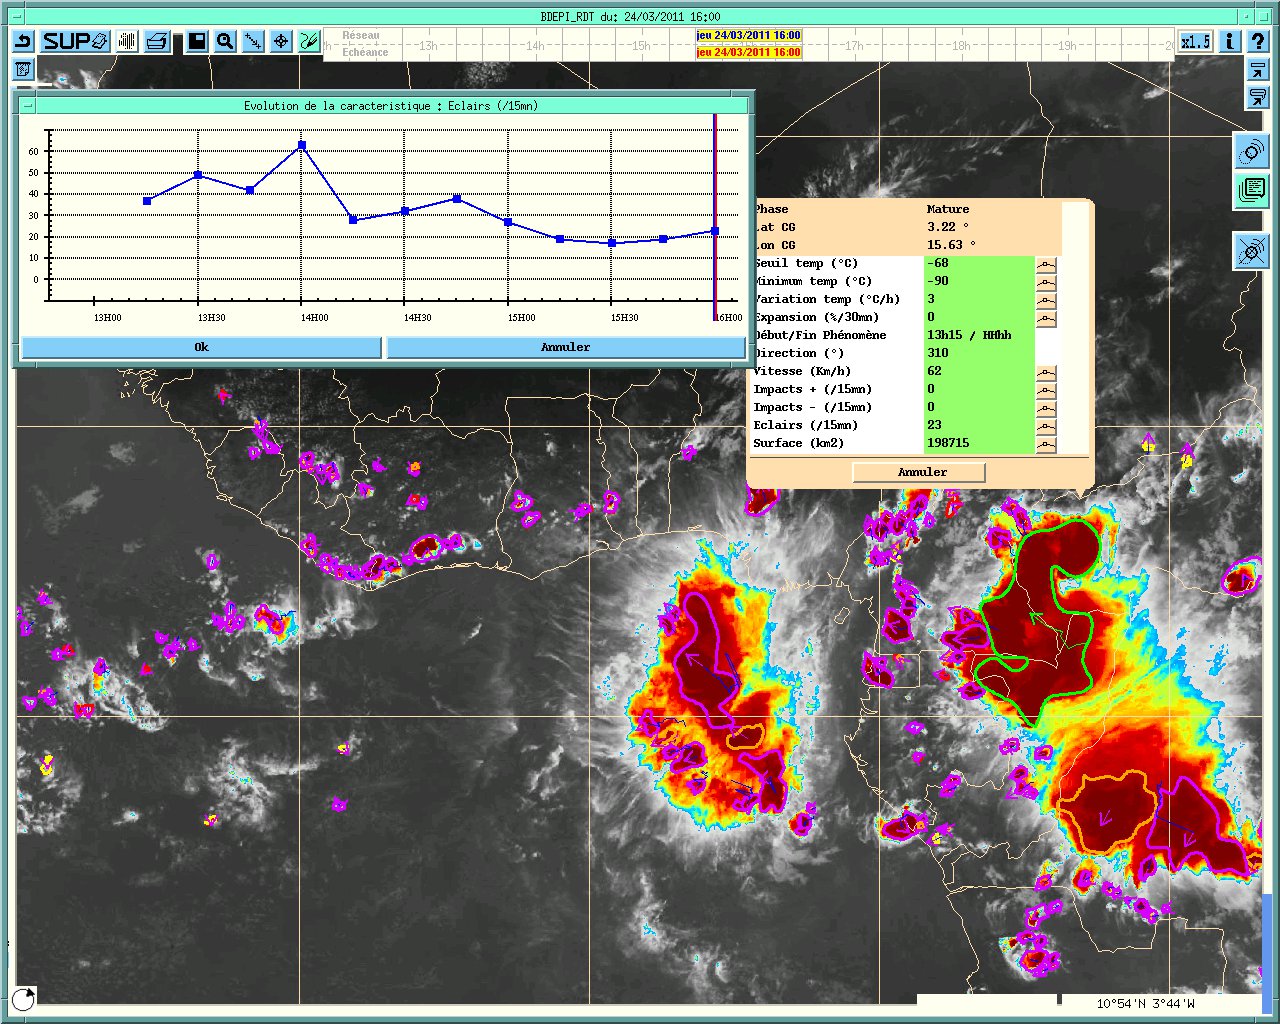
- The attributes
allows to access numerical values of
some characteristics of the RDT-CW object.
These values are displayed into a flying window. Its
visualization is activated by moving the mouse over the
contour
of the corresponding cloud system (in the image below the interest
cell's contour becomes green).
- The history is available through time series of past evolution of the following characteristics. The visualization of these series is interactive with the corresponding RDT-CW object
- Number of positive / negative / intracloud lightning impacts registered below or in the convective system (in this example, Cloud-to-ground lightning time serie associated to the green-focused cell).
- Threshold temperature and minimum temperature of cells
- .../...
=>In NWCSAF real-time production chain, other choices for the vizualisation have been made : the cells are distinguished by their cooling rates.
Example of RDT-CW visualization through SYNERGIE forecaster's tool (left) , through SYNOPSIS forecaster's tool (right)
Other SAFNWC PGEs attributes , 3D description
CT, CRR and second level
- Some attributes are affected to the main (BT "Base of Tower") contour level only : tracking parameters (speed, duration), expansion rate
- Few attributes are common to both levels : minimum temperature,
cooling rate, ...
- Other parameters may be different at each level :
threshold, area, position, external characteristics (top pressure,
cloud type and phase, rain rate)
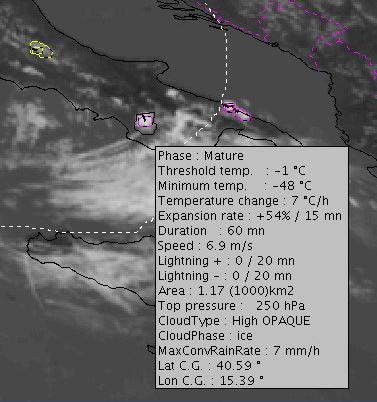
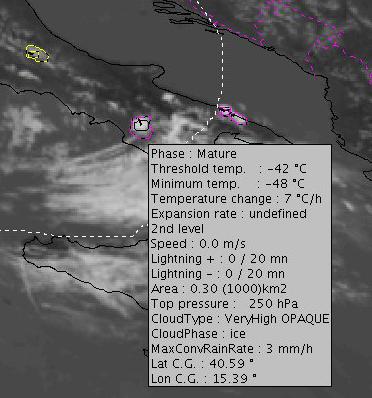
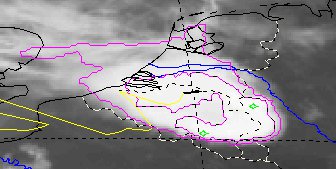
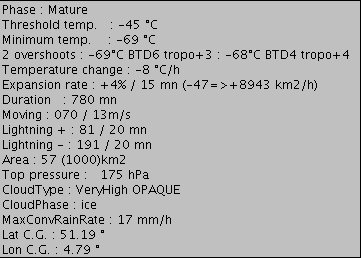
Main and second level attributes of RDT-CW cloud cell over Italy. Concerned contour highlighted in black
Overshooting top detection (OTD)
The visualization is allowed through punctual localization on the IR image and limited characteritics in the jauge
- The main points (minimum temperature, maximum of BTD ...) of
overshooting top are pointed with a green diamond.
- Some of their characteristics may be displayed in the jauge : temperature, BTD=WV6.2-IR10.8, temperature gap over NWP tropopause
 |
 |
A
case study (25/05/2009)
The
following case study deals with diurnal
convection triggering over Adriatic edges, and heavy convection
developing in a convergence line in the afternoon over France. This case study is also detailled for previous releases in SAFNWC Topical Image Gallery or in RDT-CW web pages
On this visualization tool, yellow lines represent convective cloud trajectories, and black arrows a 30min move of gravity centers. The contour's colors are the same as mentionned above.
Second level contour appears sometimes depending on cloud morphology, and allow to identify Cloud Cap
Ovsershooting tops appear as green diamond

An
extended application
The lack of ground truth over
Africa didn't allow to
evaluate discrimination and precocity skill of RDT-CW on such an area.
Nevertheless, the final result seems to be fine for the users
involved (take note of better ratio between convective and no
convective systems and a
stronger cooling rates compared to European cloud systems). The RDT-CW is now processed over the whole African continent, and displayed through forecaster tool SYNERGIE for French Army, but also for Aeronautical purposes. Below is presented a 3h-loop of "observed" RDT-CW, extended with 1h nowcasts, based on dilatation and advection of diagnosed motion.
On this example, RDT-CW manages small rapid developing convective cells (with deep cooling up to 20-30degC in 15min) , but also large MCSs lasting several hours (displayed here without additionnal level, full trajectory does not appear in this example because limited to 3 hours).
The loop shows good tracking of MCS and good depiction of small cells.
The configuration file
Input Data
SEV_BANDS channel bands to be used by PGE VIS06 WV62 WV73 IR87 IR108 IR120 IR134CT 0(default) or 1 if using CT product for additional attributes Cloud Type and Cloud Phase
CMa 0(default) or 1 if using CT product for masking non cloud pixels
CMIC 0(default) or 1 if using CMIC product for microphysics characteristics
CTTH 0(default) or 1 if adding top cloud attribute via CTTH product
CRR 0(default) or 1 if using CRR product for additional attribute
HRW 0(default) or 1 if using HRW product as guess data for movement estimation
NWP
data parameters
NWP_PARAM NWP_SP
Surface
pressure : resolution(1) and interpolation method(BLI)NWP_PARAM NWP_2T 2m temperature
NWP_PARAM NWP_2D 2m dew point temperature
NWP_PARAM NWP_2RH 2m relative humidity (when available)
NWP_PARAM NWP_SGEOP Surface geopotential height
NWP_PARAM NWP_ALTM altitude of ground (when available)
NWP_PARAM NWP_T temperature at pressure levels specified in nwp_conf_file
NWP_PARAM NWP_RH relative humidity at pressure levels specified in nwp_conf_file
NWP_PARAM NWP_GEOP geopotential height at pressure levels specified in nwp_conf_file
NWP_PARAM NWP_UW U component of wind at pressure levels specified in nwp_conf_file
NWP_PARAM NWP_VW V component of wind at pressure levels specified in nwp_conf_file
NWP_PARAM NWP_TT tropopause temperature (when available)
NWP_PARAM NWP_TP tropopause pressure (when available)
NWP_PARAM NWP_LI Lifted index (when available)
NWP_PARAM NWP_KI K index (when available)
NWP_PARAM NWP_SHW Showalter index (when available)
NWPMVTLVL Pressure level of U/V NWP data as guess data for movement estimation (default 700hPa)
Lightning
data parameters
LGH
0(default) or N (-1 or N>0) if
using lightning data for data blending and additional attribute0 (default) : no association
-1 : association without forcing discrimination result
N : association with impact forcing convective diagnostic from Nth impact
LGHDTANT time limit (sec) before current slot for considering lightning data
LGHDTPOST time limit (sec) after current slot for considering lightning data
LGHTLR spatial tolerance (nb of pixels - default 3) for pairing lightning stroke with cloud cell
LGHPROXI maximum distance (nb of pixels - default 0) for processing distance between lightning stroke and cloud cell
Detection
parameters
TCOLD
cold temperature threshold when
multiple thresholding, deg Celsius. Recommended
temperature is -75 degCTWARM warm temperature threshold when multiple thresholding, deg Celsius. Recommended temperature is 5degC
DELTATEMPE temperature step between Tcold and Twarm, deg, default 1
SMIN min detection area , km2, default 1. Recommended value is 60
SMAX max detection area , km2, default no limit. Recommended value is 200 000
Discrimination options
CRRDISCRI 0(default) or >=1 if using high values of CRR for forcing convective diagnosticTROPICALDISCRI 0(default) or value(degC) if using colder values of BT for forcing convective diagnostic
Additional options
DBG More precise Informations on program running, default 0 (no information)Output Data
FCST 0(default) or maximum range value (min) for forecast products - nb of products = FCST/update raterecommanded value = 60min for FDSS, 20min for RSS (4 additional forecast products)
PARALLAX 0(default) or 1 for activation of parallax correction
SMOOTHPTS 1(default) or >1 for nb of pts taken into account for smoothing contours
NCMAPINCLD 0(default) or 1 if map of convective cells included in Netcdf product
INT_PRODUCT Production of the ended trajectories file (default NO )
TRAJ Format specification of the ended trajectories file when requested (ex: TISXOLH)
TRAJPROD production frequency of ended trajectories file : 0=> monthly 1 => daily 2 => each slot(default)
The Documentation
SAFNWC user
documentation for PGE19:- Product User Manual
- Algorithm Theoretical Basis Document
- Validation Report