
Automatic Satellite Image Interpretation - Gravity Waves
NWCSAF/GEO v2021
Table of Contents
1. Goal of the ASII-NG products
2. ASII-GW algorithm summary description
3. List of inputs for ASII-GW
4. Coverage and resolution
5. Description of ASII-GW output
6. Example of ASII-GW visualisation
Access to "Algorithm Theoretical Basis Document for the "Automatic Satellite Image Interpretation - Next Generation" Processor of the NWC/GEO" for a more detailed description.
1. Goal of the ASII-NG products
In contrast to the ASII product, where the focus is on identification of conceptual models, the next-generation ASII-NG product group in its current stage is clearly linked to Clear Air Turbulence (CAT), which makes it relevant for meteorologists and aviation end users.
Clear-air turbulence is generally non-convective turbulence outside the planetary boundary layer, often in the upper troposphere. CAT typically has a patchy structure and horizontal dimensions of 80-500 km in the along-wind direction and 20-100 km in the across-wind direction. Vertical dimensions are 500-1000 m, and the lifespan of CAT is between half an hour and a day (Overeem 2002). As CAT involves physical processes with scales usually smaller than the resolution of numerical weather prediction (NWP) models, forecasts of CAT with NWP are difficult to perform. Therefore, it is of interest to identify areas with risk of CAT from satellite observations. Common causes and sources of CAT are:
- Tropopause folds
- Gravity waves (e.g. mountain waves)
- Air mass boundaries (e.g. fronts)
- Wind shear (e.g. jet streams)
- Thunderstorm complexes
At this stage, the feature detection covers the first two phenomena in two separate sub-products, ASII-TF for tropopause foldings and ASII-GW for gravity waves.
2. ASII-GW algorithm summary description
Gravity waves can be detected in satellite imagery through the characteristic patterns of alternating bright and dark stripes they cause (e.g. in Figure 1 below). The product is based on a pattern recognition algorithm seeking such regularly arranged stripy features in water vapour and infra-red imagery. Details can be found here.
3. List of inputs for ASII-GW
- WV 7.3 µm image, from SEVIRI, GOES-R or Himawari
- IR 10.8 µm image, from SEVIRI, GOES-R or Himawari
4. Coverage and resolution
- The products are extracted in full image resolution using the satellite projection.
- The region for processing is user-defined.
5. Description of ASII-GW output
The ASII-NG products are encoded in standard NWCSAF netCDF output files. Apart from the standard fields, the ASII-GW netCDF files hold the derived probability for occurrence of gravity waves. To each pixel, a value between 0 and 100% is assigned, separately determined for the IR and the WV channel, respectively. Additionally, status flags are provided to give details on processing issues. A quality flag indicates the number of slots a gravity wave probability > 0% has been obtained at the pixel in the WV and IR channel, respectively, without interruption (supporting the distinction of pattern accidentally matching in just one image from longer-persisting, reliable signals).
6. Example of ASII-GW visualisation
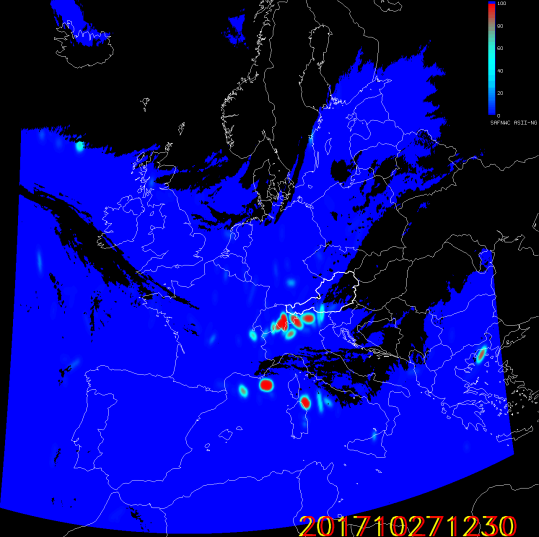
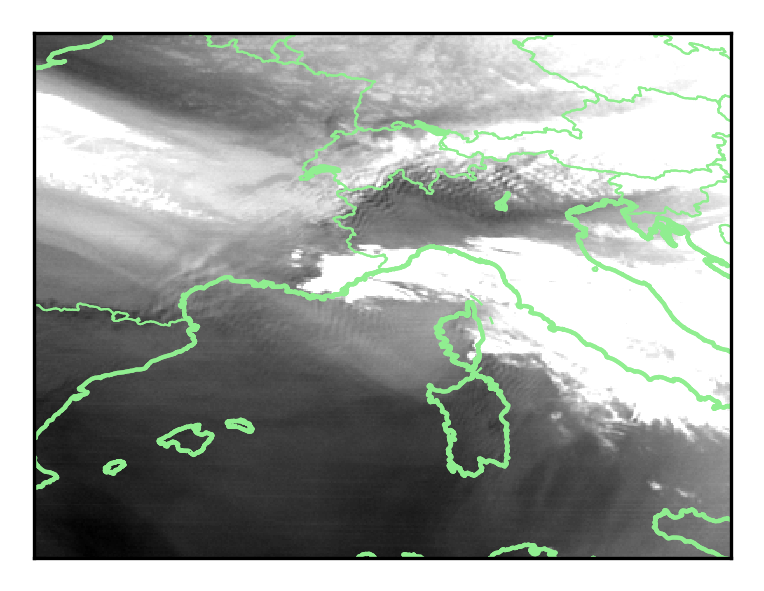
Figure 1: Case of 27 October 2017, 1230 UTC. Upper panel: Probability of gravity wave occurrence determined from the WV image (highest probabilities in red). Lower panel: The (contrast-enhanced) SEVIRI WV7.3 image