
Convection Initiation (GEO v2021)
- Goal of the CI product
- CI Algorithm summary description
- Coverage and resolution
- List of inputs for CI an configuration parameters
- Description of CI Output
- Example of CI visualization
Access to user documentation for more details on Convection Products:
- User Manual
- Algorithm Theoretical Basis Document
- Validation Report
1. Goal of the CI product
The CI (Convection Initiation) product has been developed by Meteo-France in the framework of the EUMETSAT SAF in support to Nowcasting. Using mainly geostationnary satellite data, it provides the probability for a cloudy pixel to become a thunderstorm within a forecast interval. The product aims to catch the first steps of initiation of convection, when the first convective signs occur after the formation of clouds, or when those signs appear revealing a modification of environmental conditions.
Probability of the formation of a thunderstorm depends on evolution of local condition and on advection of clouds. CI is a pixel product. CI is defined for three time-steps (0-30’, 0-60’ and 0-90’) and for four classes of probability (0-25%, 25-50 %, 25-50 %, 75-100%). Recommendation is to use in this version CI as a "Yes or No" product.
2. CI Algorithm summary description
The process follows:
- The definition of areas of interest
- The estimation of 2D movement field
- The cloud cell detection and tracking based on a object analysis approach
- A pixel analysis of BTD and trends
- A day-time microphysics filtering
- Interest fields filtering
- CI diagnosis
- Forward scheme
Relevant parameters, thresholds and some part of the algorithm are inspired from:
- Best Practice Document, 2013, for EUMETSAT Convection Working Group, Eds J.Mecikalski, K. Bedka and M. König, especially SATCAST methodology for the definition of pre-CI pixels.
- Karagiannidis, A., 2016, Final Report on Visiting Scientist Activity for the validation and improvement of the Convection Initiation (CI) product of NWC SAF v2016 and v2018, Visiting Scientist Activity followed in Nowcasting Department of Météo France, Toulouse, France Period June-December 2016, for the tuning (thresholding, split of the algorithm in day and night parts), use of CMIC product and CI diagnosis (interest fields' thresholds and coefficients).
Contribution to the validation has been made by:
- Lenk, S., Senf, F., Deneke, H., 2018, Associate Scientist Activity for the validation of the Convection Initiation (CI) product of NWCSAF v2018, Associate Scientist Activity conducted at Nowcasting Department of Météo-France, Toulouse, May-August 2018, available on nwcsaf.org, for the objective validation of the CI.
Areas of interest
This preliminary step requires in optimum configuration:
- NWP data, to eliminate stable areas and focus on more unstable pixels,
- Cloudy filtering, to filter non-cloudy pixels with NWCSAF cloud products, and focus on very low, low and medium categories
- 10.8µm (or equivalent) BT to ignore cold cloudy pixels
Thus large areas are ignored. A restricted set of pixels is analysed.
2D Movement field
A 2D movement field is estimated in optimum configuration with blending 850hPa NWP wind fields and last available HRW wind observations, remapped on grid-field and selected versus the corresponding pixel’s brightness temperature. Priority in the blending is given to HRW wind observations, affected to a 24-pixels-box centred on the corresponding pixel.
This blended field is at first used as guess movement for initialization in the tracking process of object analysis (“cold start” cases, or orphan cells).
Then this field is updated with objects movement vectors, to finally be considered as a pixel tracker for trends calculations.
Object image analysis: warm cloud cell detection & tracking
An object analysis process is undertaken. The objectives of this step are:
- To take benefit from techniques allowing to catch cloud cells movement
- To access cloud cells’ parameters variations along its trajectory
More details about tracking can be found in Convection products ATBD.
CI and RDT share some part of the algorithm concerning detection and tracking. Although in CI program the cell detection and tracking is performed over the whole troposphere to be realistic, only warm cells are considered to upgrade the movement field and only warm pixels are kept in further analysis (cold cloudy pixels filtering).
This step takes benefit from movement guess field input to increase cell’s speed reliability, and on the other hand delivers output an updated movement field with the analyzed objects’ speeds. All pixels belonging to a tracked cloud system are affected the corresponding movement speed instead of previous pixel’s movement values.
This final blended movement field is a key point for further relevant trends calculations
Pixel image analysis
Brightness Temperature Differences are processed for each eligible-CI pixel from various available channels, for current data and data from previous slot. Trends computation and slot selection are adapted to satellite scan frequency.
BTDs taken into account are:
- WV6.2-WV7.3,
- WV6.2-IR10.8
- IR10.8-IR8.7
- IR12.0-IR10.8,
- IR13.4-IR10.8
Then, BT (IR10.8) and BTD trends are calculated for each eligible-CI pixel using the speed and direction of updated 2D movement field as guidance for identifying pairs of current and corresponding pixels in previous image.
When tracking of aggregated pixels (belonging to a tracked cloud system as object) is available, corresponding trends are used for some parameters instead of single pixel-trends, and should be able to provide trends over longer depth.
A day-time microphysics filtering
During day-time when microphysics parameters COT (Cloud optical thickness), LWP (liquid water path) and IWP (ice water path) are available from CMIC product, they are used as an additional filter to focus on relevant areas.
| Parameter name | Relevant value | Meaning |
| COT | 13.42 (unitless) | Cloud optical thickness |
| LWP | 0.22 kg/m² | Liquid Water Path |
| IWP | 0.17 kg/m² | Ice Water Path |
A cloudy pixel is eligible for convection initiation, only when at least one of the three microphysics parameters have a value over the threshold.
Interest fields
Each eligible-CI has then a list of BT (Brightness Temperature) and BTD (Brightness Temperature Difference) values and trends. According to previous studies about convection initiation, parameters are grouped as:
- Representative for Cloud-top Glaciation
- IR10.8 BT,
- IR10.8 - IR8.7 BTD (Called 'BTD4').
- Representative for Cloud depth / vertical extension
- WV6.2 - IR10.8 BTD (Called 'BTD'),
- IR13.4 - IR10.8 BTD (Called 'BTD6'),
- IR12.0 - IR10.8 BTD (Called 'BTD5'),
- WV6.2 - WV7.3 BTD (Called 'WBTD').
- Representative for Cloud growth (updraft)
- All BTDs trends
- IR10.8 BT trends.
Some parameters of all eligible-CI pixels will be analysed for a CI-diagnosis (see table below).
| Parameter name | Relevant value | Meaning |
| BT IR10.8 | > -25° | Brightness temperature (glaciation) |
| BTFZG | Within 30 min | Time since crossing 0 °C (glaciation) |
| BTD4 | ]-10° , 0 °C[ | IR10.8-IR8.7 (glaciation) |
| BTD | ]-35° , -10 °C[ | WV6.2-IR10.8 (height) |
| BTD5 | ]-3° , 0 °C[ | IR12.0-IR10.8 (height) |
| BTD6 | ]-25° , -5 °C[ | IR13.4-IR10.8 (height) |
| WBTD | ]-25° , -3 °C[ | WV6.2-WV7.3 (height) |
| TxBT 15’ | ]-4°/15’ , -50°/15’[ | Temperature change rate (growth) |
| TxBT 30’ | ]-4°/15’ , -50°/15’[ | Temperature change rate (growth) |
| TxBTD 15’ | > 3°/15’ | BTD 15 Trend (growth) |
| TxBTD 15’ | > 6°/15' | BTD 15 Trend (growth) |
Initial interest fields thresholds for pre-CI filter and CI-diagnosis, when CMIC product is available
During night-time, when microphysics parameters are not available, stricter thresholds are used for non-trend (static) parameters in order to limit the number of false alarms.
| Parameter name | Relevant value | Meaning |
| BT IR10.8 | > -25° | Brightness temperature (glaciation) |
| BTFZG | Within 30 min | Time since crossing 0 °C (glaciation) |
| BTD4 | ]-2.1° , 0 °C[ | IR10.8-IR8.7 (glaciation) |
| BTD | ]-34° , -12 °C[ | WV6.2-IR10.8 (height) |
| BTD5 | ]-2.2° , 0 °C[ | IR12.0-IR10.8 (height) |
| BTD6 | ]-17° , -6 °C[ | IR13.4-IR10.8 (height) |
| WBTD | ]-17° , -7 °C[ | WV6.2-WV7.3 (height) |
Night-time Interest fields thresholds for static parametersfor pre-CI filter and CI-diagnosis
CI diagnosis
The CI output is estimated with empirical rules defined by count of relevant criteria. The principle is to sum up the number of relevant parameters (i.e. above relevant threshold given in the tables above) by group, giving greater importance to growth family parameters, then glaciation parameters, and finally vertical extension (height) group.
| Nb of Growth relevant parameters (over 3) | Nb of Glaciation relevant parameters (over 3) | Nb of Height relevant parameters (over 4) | Result |
| >or= 3 | >or= 3 | >or= 4 | HIGHPROB |
| | | >or= 3 | MODPROB |
| | >or= 2 | >or= 4 | LOWPROB |
| >or= 2 | >or= 3 | >or= 4 | MODPROB |
| | | >or= 3 | LOWPROB |
| | >or= 2 | >or= 4 | VLOWPROB |
| | | >or= 4 | VLOWPROB |
| Other cases | 0 | ||
Empirical rules for CI-diagnosis. HIGHPROB means between 75 and 100%, MODPROB between 50 and 75%, LOWPROB between 25 and 50%, VLOWPROB between 0 and 25%
The forward scheme
Once a pixel is diagnosed as CI, the diagnosis is spread all along the trajectory which has been defined according to the pixel tracker. The movement field is refreshed with pixel position when spreading the trajectory. Figure below illustrates the forward scheme.
Forward scheme
3. Coverage and resolution
The CI software is designed to allow the processing at normal resolution of any rectangular areas defined by the user inside MTG, MSG, GOES-16, GOES-17, GOES-18, GOES-19, HIMAWARI-8 or HIMAWARI-9 geostationary satellite domains (the processing of the full disk is also possible). The validity of the CI product is committed inside the MTG, MSG, GOES-16, GOES-17, GOES-18, GOES-19, HIMAWARI-8 or HIMAWARI-9 full disks. For example, the NWC SAF runs the CI on a MSG sub-domain centered on Europe.
4. List of inputs for CI an configuration parameters
Input Data
SEV_BANDS channel bands to be used by PGE WV62 WV73 IR87 IR108 IR120 IR134CT 0(default) or 1 if using CT product for additional attributes Cloud Type and Cloud Phase
CMIC 0 (default) or 1 if using CMIC product as additional day time filtering
HRW 0(default) or 1 if using HRW product as guess data for movement estimation
NWP data parameters
NWP_PARAM NWP_UW U component of wind at pressure levels specified in nwp_conf_fileNWP_PARAM NWP_VW V component of wind at pressure levels specified in nwp_conf_file
NWP_PARAM NWP_LI Lifted index (when available)
NWP_PARAM NWP_KI K index (when available)
NWP_PARAM NWP_SHW Showalter index (when available)
NWPMVTLVL Pressure level of U/V NWP data as guess data for movement estimation (recommanded 850hPa)
Detection parameters
TCOLD cold temperature threshold when multiple thresholding, deg Celsius. Recommended temperature is -75 ºCTWARM warm temperature threshold when multiple thresholding, deg Celsius. Recommended temperature is 10 ºC
DELTATEMPE temperature step between Tcold and Twarm, deg, default 1ºC
DELTATTOUR Minimum budding extension for the cell detection step, default 3ºC
SMIN min detection area, km², default 1. Recommended value is 1 km² for the MSG satellites, 60 km² for the new generation satellites.
SMAX max detection area, km², default no limit. Recommended value is 400 000 km²
Additional options
CANAL_UTIL Main channel used for the cell detection and tracking steps. Default is channel number 16 (IR10.8 µm channel). Recommended value for GOES-16 is channel number 15 (IR10.3 µm channel).DBG More precise Informations on program running, default 0 (no information)
OMP_NBTHREAD Number of threads when parallelisation is activated, default 3
LICONV Threshold to define convective state based on Lifted Index (value below threshold). Default Threshold is -3.
LINOCONV Threshold to define stable state based on Lifted Index (value over threshold). Default Threshold is 0.
KICONV Threshold to define convective state based on K Index (value over threshold). Default Threshold is 30.
KINOCONV Threshold to define stable state based on K Index (value below threshold). Default Threshold is 20.
SHWCONV Threshold to define convective state based on Showalter Index (value below threshold). Default Threshold is -3.
SHWNOCONV Threshold to define stable state based on Showalter Index (value over threshold). Default Threshold is 3.
5 Description of CI output
Data are provided in NetCDF format.
The product is an image-like product. Its target structure contains three main containers dedicated to the three specified periods [0-30mn], [0-60mn] and [0-90mn]. All ci_prob containers have the same structure, given in table below.
| code | ci_prob30 container |
| 0 | no probability to become thunderstorm |
| 1 | 0-25% probability to become thunderstorm in the next 30minutes |
| 2 | 25-50% probability to become thunderstorm in the next 30minutes |
| 3 | 50-75% probability to become thunderstorm in the next 30minutes |
| 4 | 75-100% probability to become thunderstorm in the next 30minutes |
The current CI-Netcdf format is described in details in the Document Output Format (DOF) of SAFNWC.
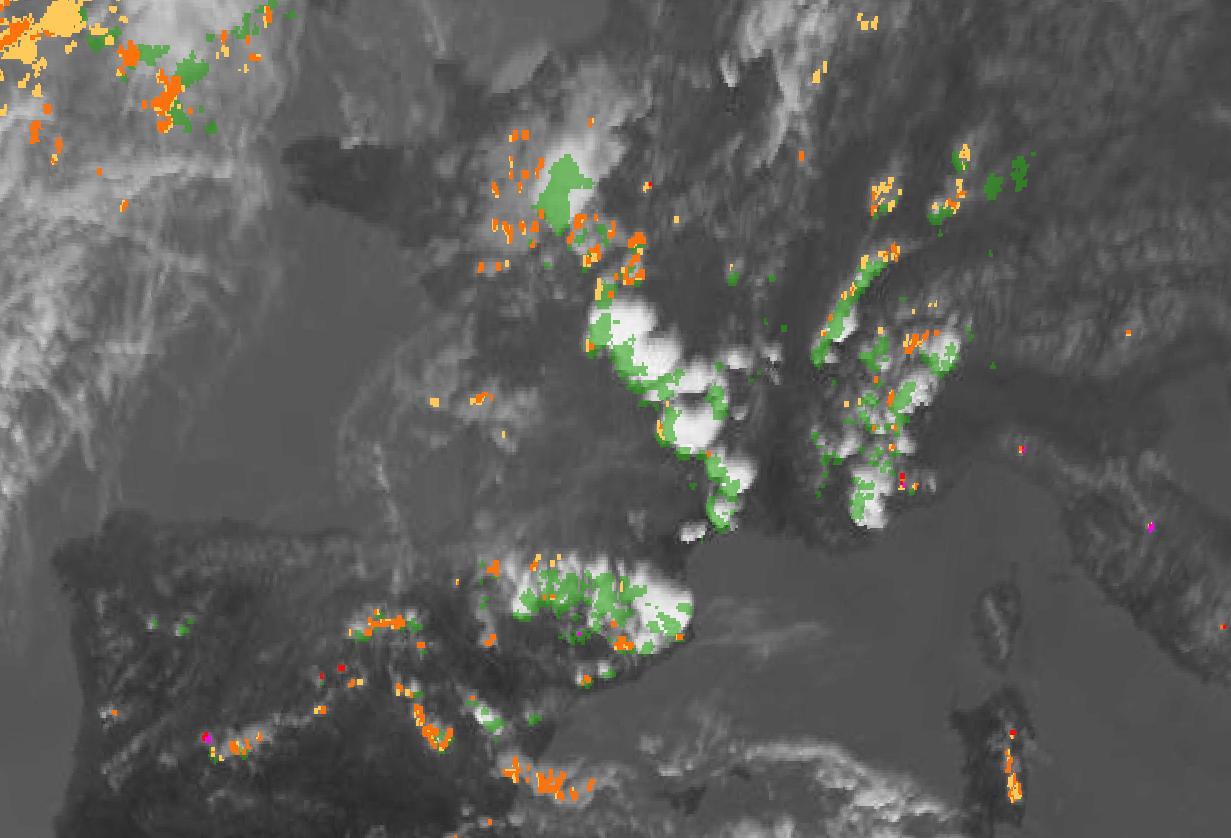
6 Example of CI visualization
CI product is a pixel-based product.
20100628 CI Case Study - 13h00Z IR image, superimposed with CI_prob30 and [13h00Z-13h30Z] accumulated radar > 30dBZ seen as ground truth (green shading).
The color code for visualization of CI is as follow:
- yellow for [0-25%] probability of Convection initiation,
- orange for [25-50%] probability of Convection initiation,
- red for [50-75%] probability of Convection initiation,
- magenta for [75-100%] probability of Convection initiation.