To download the video AVI file with the loop click on the image or use this
link
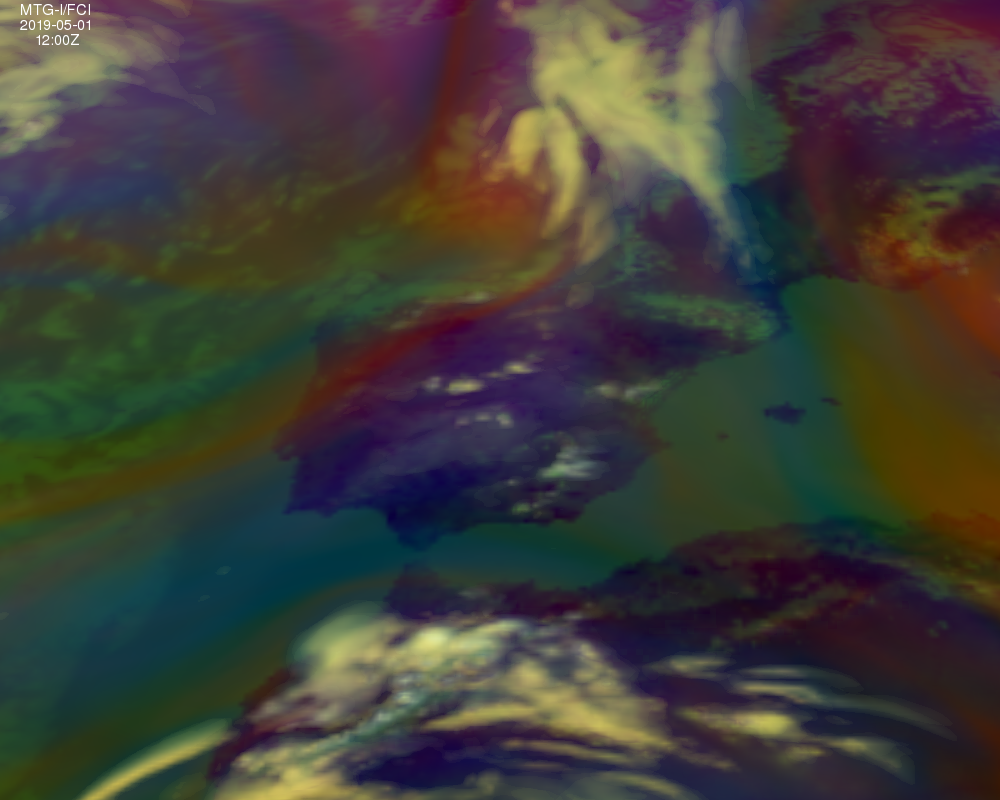
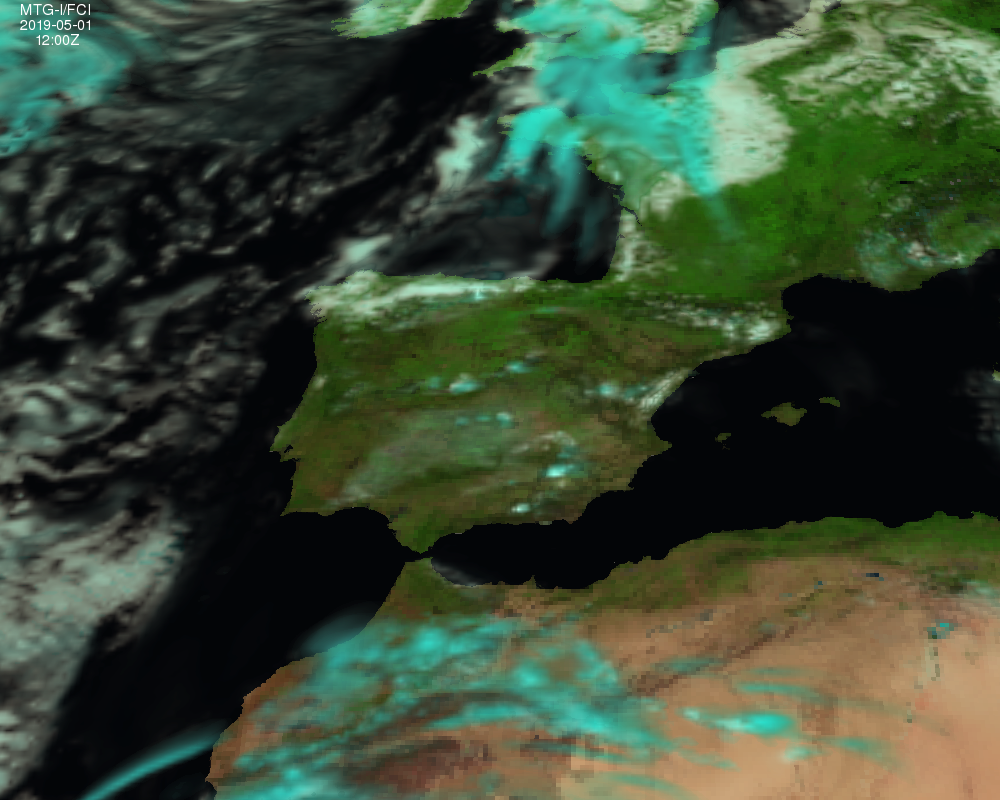
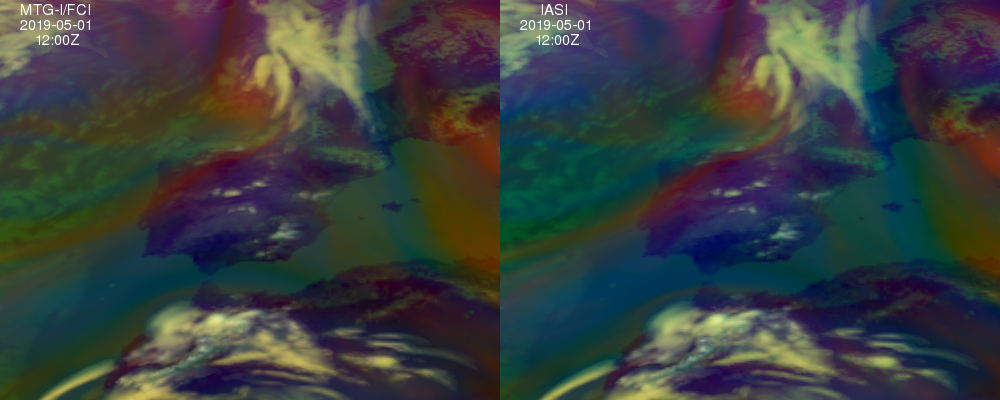
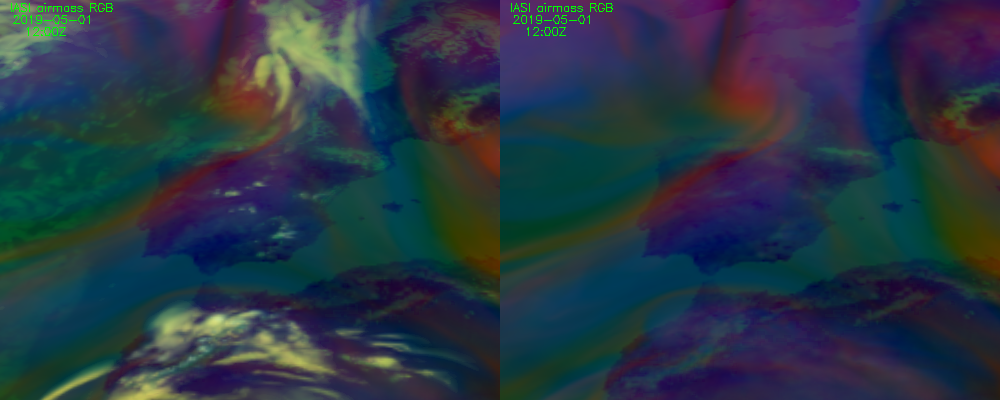
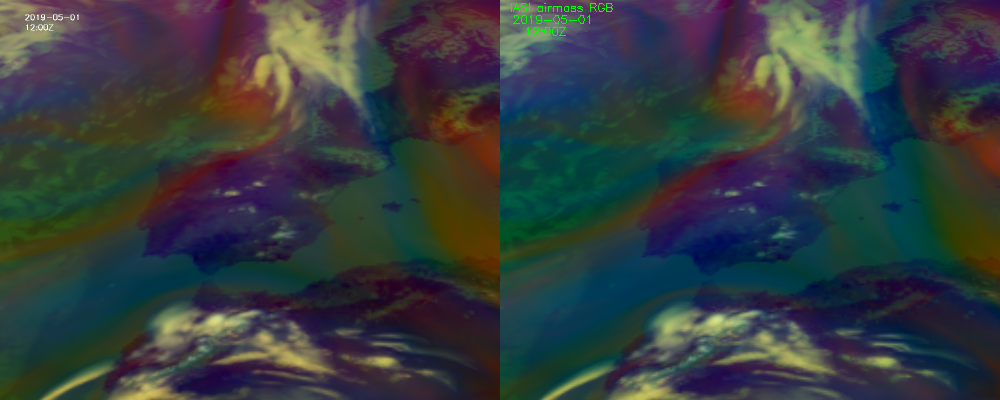
Comparison of temporal resolution of
synthetic FCI airmass RGBs every 10 mimutes (on 2x2 boxes) versus
synthetic IASI airmass RGBs every 30 minutes on MTG-I/FCI
projection at boxes IR 2x2 (resolution 4x4km on nadir).
To download the video AVI file with the loop click on the image or use this
link
More details are available in this web
page
Generation of NWC SAF products using as input the synthetic images for MTG-I/FCI
Once the synthetic radiances of MTG-I/FCI have
been generated, I have created an IDL program to use the "back
door" mechanism in order to use the PGE00 MTG-I/FCI binary files
as input to the GEO PGEs. The IDl program made:
a) It reads the array (nx, ny) of the structures from PGE00 MTG-I/FCI
binary files for one slot
b) It converts the VIS channels to reflectivities and the IR channels to
BTs or radiances
c) It writes in the DATABUF ($SAFNWC/tmp/SAT directory) the files (* .BT, * .refl, * .rad)
needed to execute the different PGEs. To know what files to
generate, the files generated in $SAFNWC/tmp/SAT are reproduced
using one of the files available in the tests with the STRR
testdata.
d) In DATABUF $SAFNWC/tmp/SAT directory a
raw DTIME file is also written with all the pixels with value 0.0
Then it is posible to execute the PGEs. As a proof of concept, I have executed several of the PGEs for the
MTG version. As can be seen in the example below, outputs of the
PGEs are generated and the look is qualitatively good and
consistent. The examples below are the first outputs of several
PGEs:
Animated GIF with the CT
outputs generated using the synthetic PGE00 MTG-I/ FCI data 1st
of May 2019 forecasted from 00:00Z to 23:50Z with cloudy RTTOV
simulation.
Animated GIF with the CTTH altitude outputs
generated using the synthetic PGE00 MTG-I/ FCI data 1st
of May 2019 forecasted from 00:00Z to 23:50Z with cloudy RTTOV
simulation.
Animated GIF with the montage CMIC parameters
outputs generated using the synthetic PGE00 MTG-I/ FCI data 1st
of May 2019 forecasted from 07:00Z to 17:00Z with cloudy RTTOV
simulation.
Top left) IWP: Ice Water Path,
Top right) LWP: Liquid Water Path,
Bottom left) REFF: Effective Radius,
Bottom right) COT: Cloud Optical Thickness.
The images with the PGEs outputs have been created with McIDAS-V.
The idea is to use the profiles of T, q, CC (cloudiness), LWP,
IWP etc to compare the outputs of the products with the "truth"
used as input to RTTOV; the McIDAS-V will allow to do it
interactively.
Note: In the RTTOV call when the solar zenith
angle is greater than 75 degrees it is set to 75 degrees so there are VIS
channels both day and night and the solar zenith angle is fixed to
75 degrees in the case it is greater than 75 degrees.
Synthetic MTG images using as input AEMET Harmonie NWP model
Synthetic MTG-I/FCI and MTG-S/IRS for case
study 25 April 2021 are available in these links:
Synthetic MTG-FCI images from Harmonie NWP model
Synthetic MTG-I/FCI natural RGBs generated using
RTTOV-13.0 every 1 hour on AEMET Harmonie 0.025x0.025 degrees grid
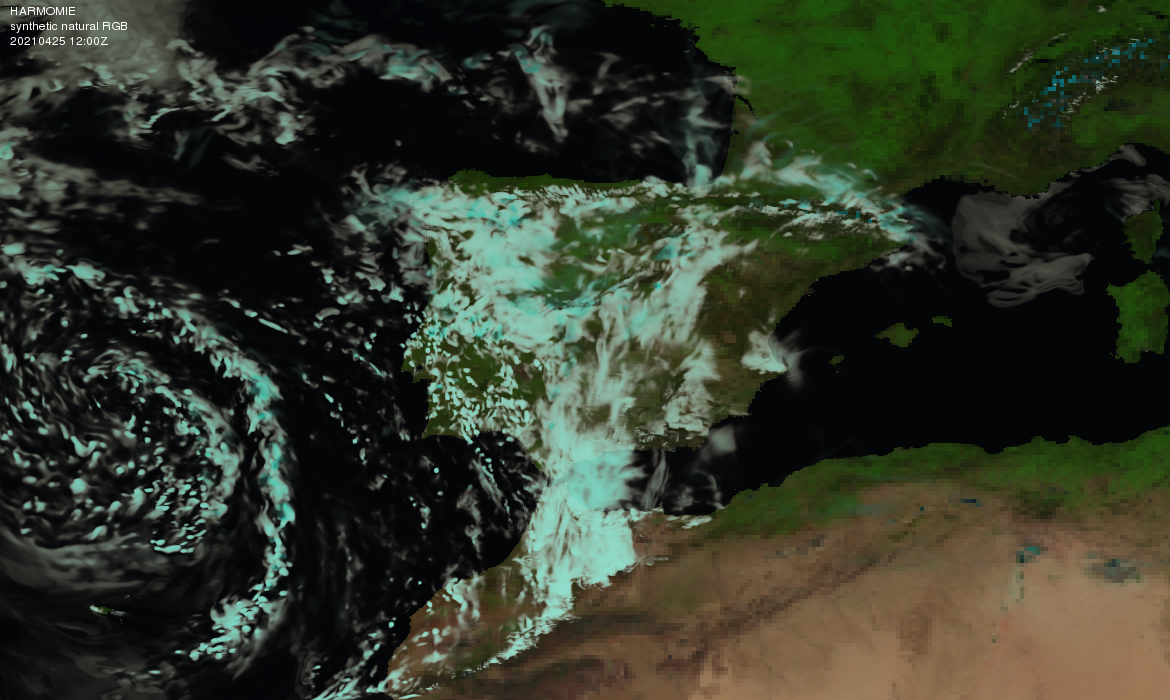
To download the video AVI file with the loop click on the image or use this
link
Synthetic MTG-I/FCI airmass RGBs generated using
RTTOV-13.0 every 1 hour on AEMET Harmonie 0.025x0.025 degrees grid
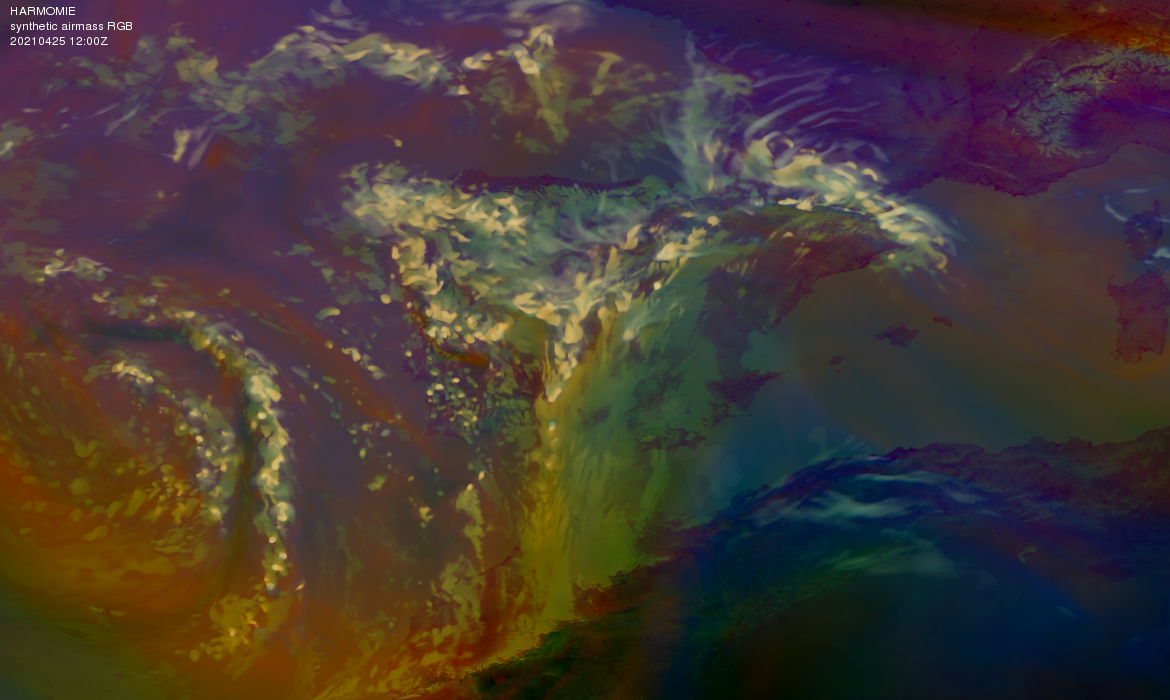
To download the video AVI file with the loop click on the image or use this
link
Synthetic MTG-S/IRS L1 images from Harmonie NWP model
Synthetic MTG-S/IRS spectra on clear air and cloudy conditions generated using
RTTOV-13.0 every 1 hour on AEMET Harmonie 0.025x0.025 degrees grid and using as input a combination of Harmonie and ECMWF (ozone profile) on the Harmonie 65 hybrid levels.
Case study 2021-04-25 from 00:00Z to 24:00Z every 1 hour.
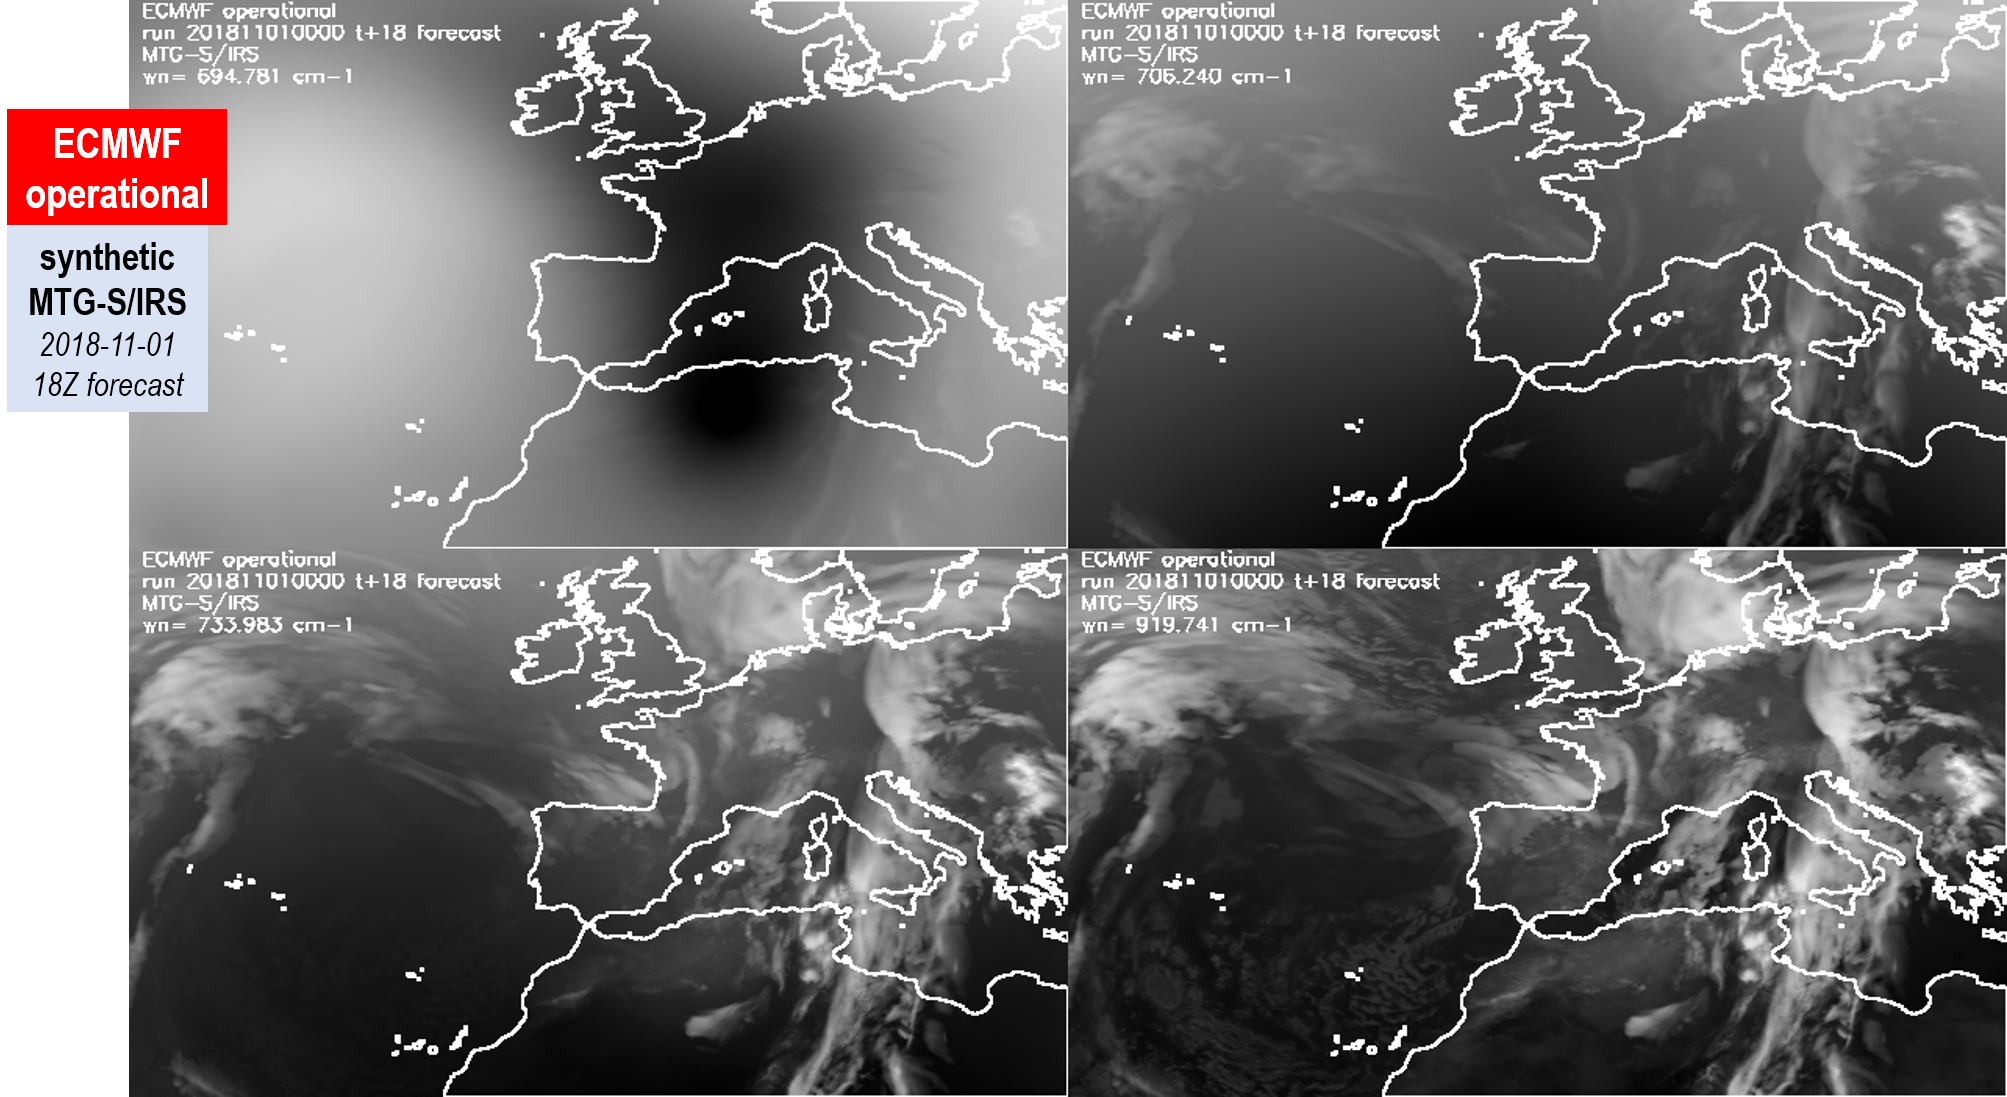
As example is shown below a loop of synthetic MTG-S/IRS BT nearest at 695, 706, 734 and
919.5 cm-1 the wavenumbers has been selected in CO2
branch to provide top to down view in the atmosphere.
Synthetic MTG-S/IRS L1 images from ECMWF high resolution experiment h3f7
ECMWF h3f7 experiment: it is a seasonal (4-months) nature run at 1.4km resolution, aggregated to 9km in MARS. A Baseline for Global Weather and Climate Simulations at 1 km Resolution, data is aggregated/truncated to 9km, and avail 3-hourly in MARS.
See reference on: https://agupubs.onlinelibrary.wiley.com/doi/full/10.1029/2020MS002192
It has been used a modified PGE00 hyper version for use combination of h3f7 experiment and ECMWF operational (some fields as T are not available on hybrid levels). By this reason it has been changed the input to read the combination of the GRIBs file from h3f7 experiment and operational ECMWF model
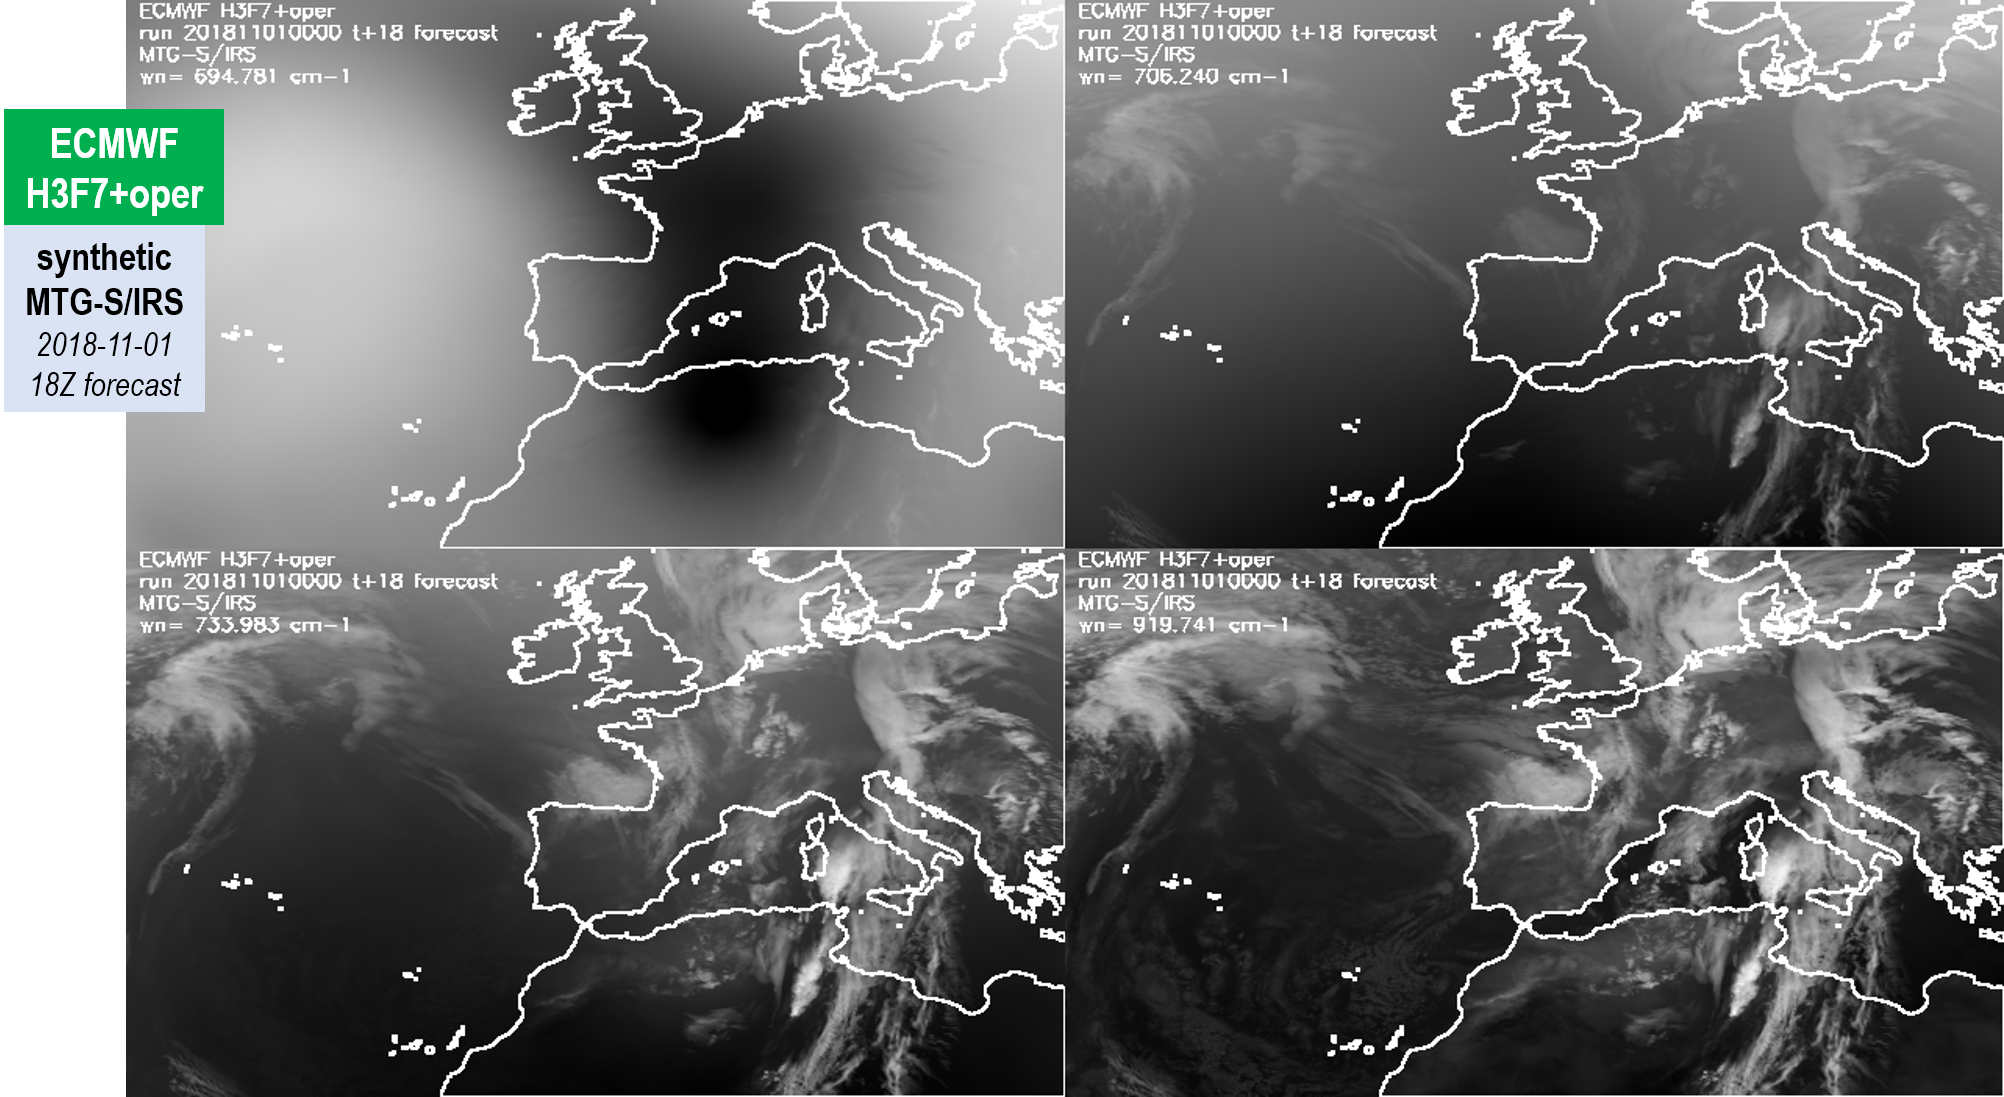
The clouds in experiment h3f7 have a better spatial resolution than the same synthetic images from the ECMWF operational model shown below.
-------------------------------------------------------------------------------------------------------------------------------------------------------------
--------------------------------------------------------------------------------------------------------------------------------------------------------
The loops below are maintained because are
links from previous presentations.
-----------------------------------------------------------------------------------------------------------------------------------------------------
-------------------------------------------------------------------------------------------------------------------------------------------------
Note: since PDFs does not
allow to include animations, this is a provisional web page
just for provide links to the animations in the presentations.
One complete web page describing the activities and case
studies will be published later.
Synthetic MTG-I/FCI and MTG-S/IRS(using IASI as proxy) for case
studies 1st May and 22th July 2019 are
available in these links:
Synthetic MTG-FCI images
a) Case study 1st May 2019:
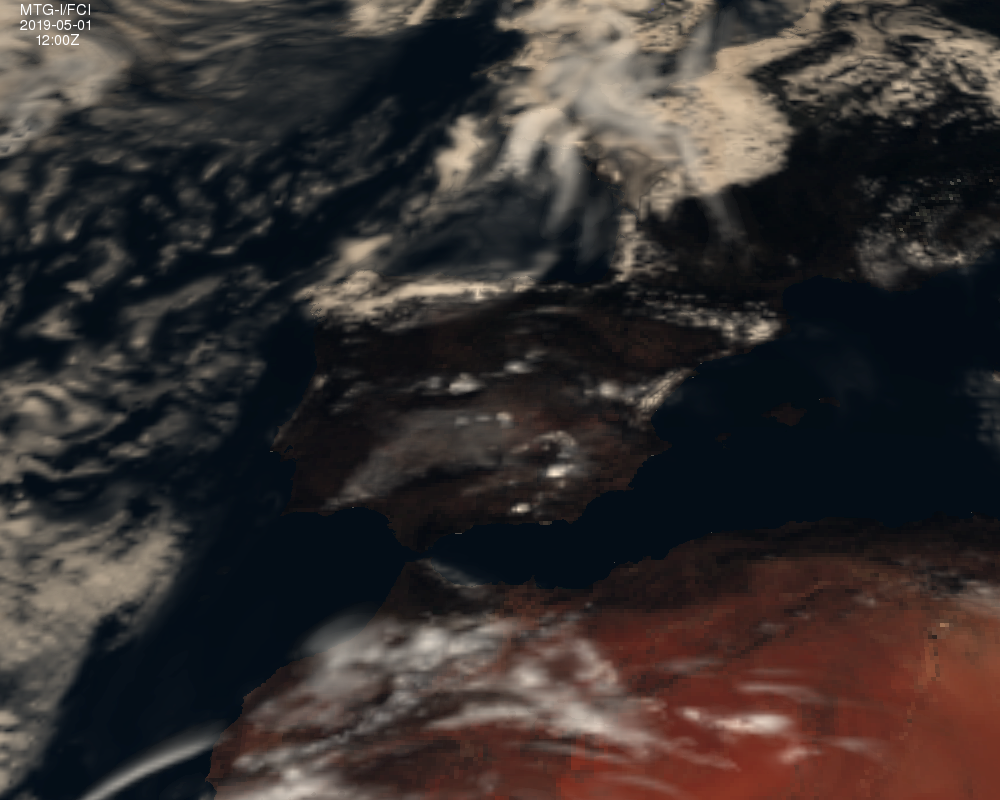
Synthetic MTG-I/FCI airmass RGBs generated using
RTTOV-12.3 every 10 minutes on MTG-I/FCI projection at IR 1x1
resolution (2x2km on nadir)
To download the video AVI file with the loop click
use this link
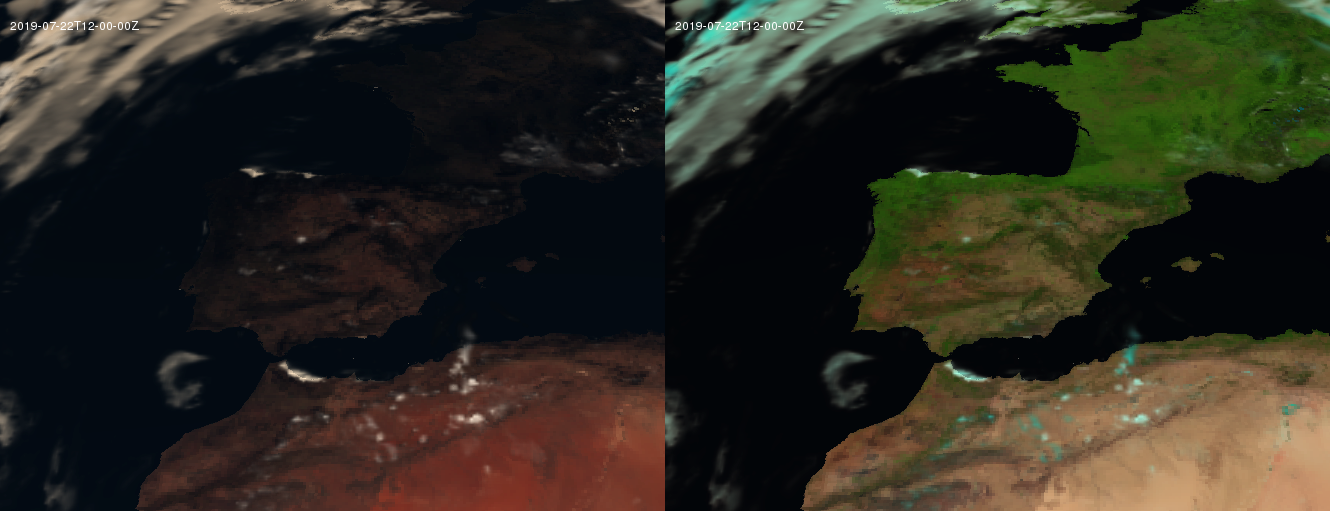
b) Case study 22th July 2019:
Synthethic MTG-I/FCI true-color and natural RGBs
generated using RTTOV-12.1 every 15 minutes on MSG/SEVIRI
projection at IR 1x1 resolution (3x3km on nadir)
To download the video AVI file with the loop click
use this link
Animated GIF with synthetic MTG-FCI VIS0.9
microns channel and the use for TPW estimation
Animated GIF with synthetic MTG-FCI NIR1.3
microns channel and the use for HL estimation (HL: precipitable
water in High Layer)
Synthetic IASI images as proxy of MTG-IRS L1 images
a) Case study 1st May 2019:
Synthetic MTG-S/IRS (using IASI as proxy) dataset. Synthetic IASI BT
spectra on clear air and cloudy conditions generated using
RTTOV-12.3 and using as input ECWMF on hybrid level every 1 hour
with 0.1x0.1 degrees.
Case study 2019-05-01 from 12:00Z to 18:00Z every 30 minutes on
MTG-I/FCI projection on boxes IR 2x2 (resolution 4x4km on nadir) on
MTG-I/FCI grid. Thus, the resolution of these images is similar to
theoretical IRS spatial resolution about 4x4 km (IR channels
MTG-I/FCI resolution is 2x2 km at nadir). It has been calculated
with MTG-I/FCI zenith angles.
As example is shown a loop of synthetic IASI BT at 695, 706, 734 and
919.5 cm-1 the wavenumbers has been selected in CO2
branch to provide top to down view in the atmosphere.

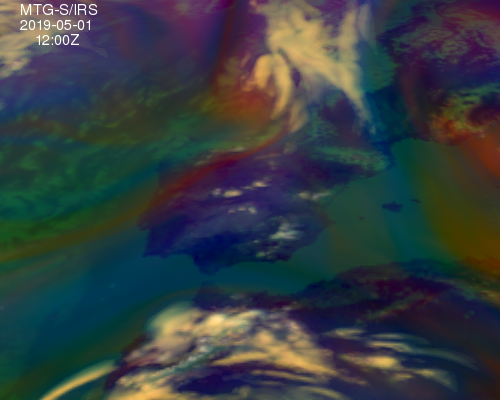
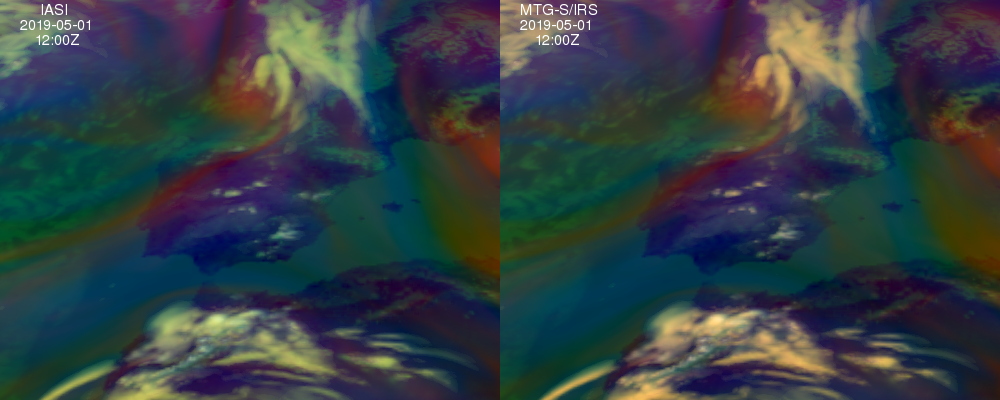
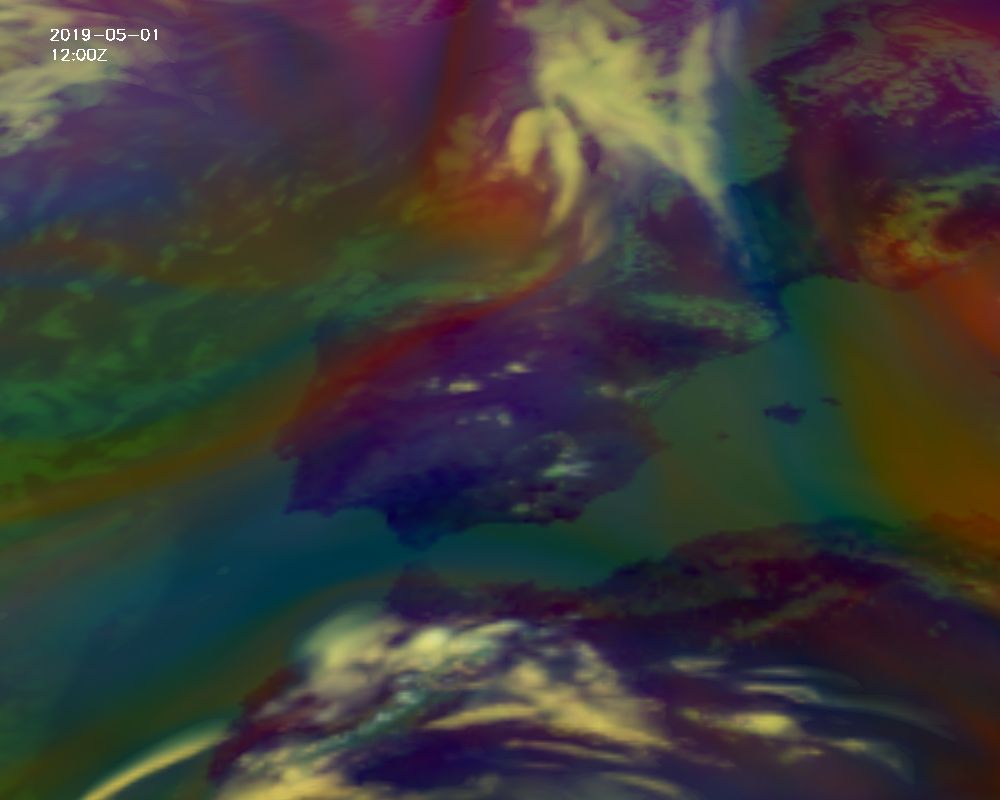
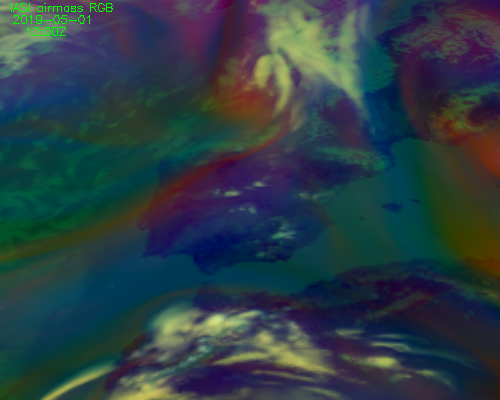
Synthetic MTG-S/IRS (using IASI as proxy) airmass RGBs generated
using RTTOV-12.3 every 30 minutes on MTG-I/FCI projection at boxes
IR 2x2 (resolution 4x4km on nadir).
To download the video AVI file with the loop click
use this link
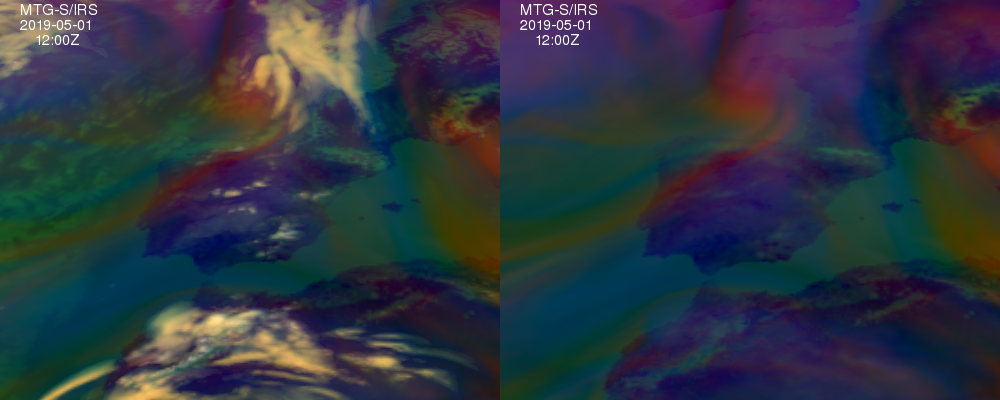
Comparison of cloudy and clear-air synthetic
MTG-S/IRS (using IASI as proxy) airmass RGBs generated using
RTTOV-12.3 every 30 minutes on MTG-I/FCI projection at boxes IR
2x2 (resolution 4x4km on nadir).
To download the video AVI file with the loop click
use this link
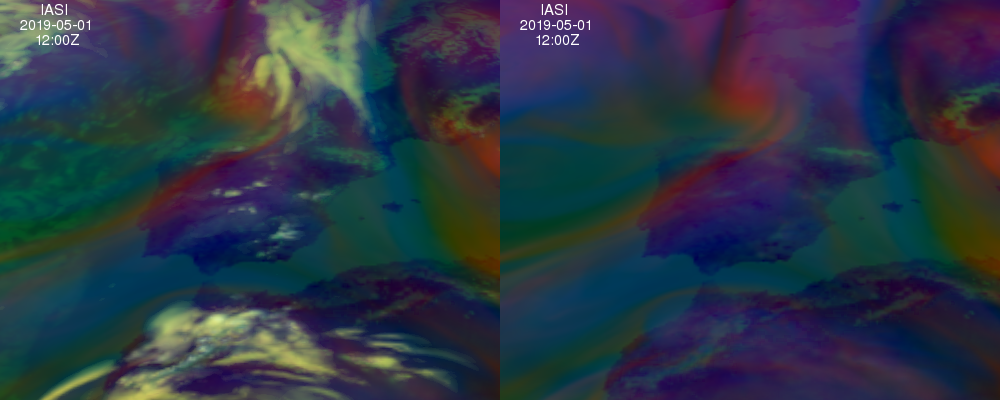
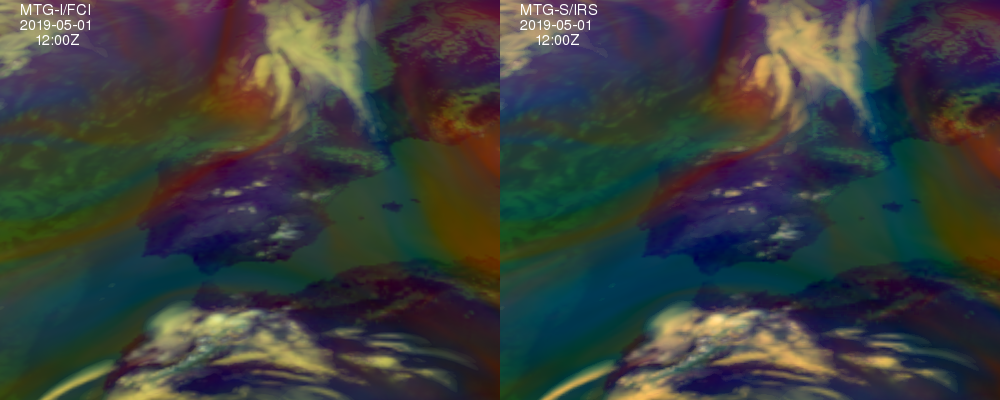
Comparison of temporal resolution of synthetic FCI airmass RGBs
every 10 mimutes (on 2x2 boxes) versus synthetic MTG-S/IRS (using
IASI as proxy) airmass RGBs every 30 minutes on MTG-I/FCI projection
at boxes IR 2x2 (resolution 4x4km on nadir).
To download the video AVI file with the loop click
use this link
b) Case study 22th May 2019:
Loop of synthetic
IASI BT spectra calculated with PGE00 using RTTOV-12.1 and as
input ECWMF on hybrid level for 2019-07-22 from 12:00Z to 18:00Z
every 30 minutes.
The synthetic IASI BTs has been calculated with
SEVIRI zenith angles and resolution 1x1 pixels on MSG grid (3x3
km); same spatial resolution that above MTG-FCI images.
The region used is around the region covered by
a future MTG-IRS dwell (160x160 array at 4x4 km).
As example is shown a loop of synthetic IASI BT
at 695, 706, 734 and 919.5 cm-1; the wavenumbers has
been selected in CO2 branch to provide top to
down view in the atmosphere.