Note: since only PDF version has been
upload, this
is a provisional web page just for provide links to the
animations in the Martinez's presentation on the 2020 NWC SAF Users'
Workshop. One complete web page
describing the case study will be published.
The images corresponding to the 22th July 2019 from
SEVIRI instrument on MSG-4 are shown in the videos below:
Combination of RGBs images, iSHAI fields and
ECMWF fields (collocated with MSG images using PGE00 tool)
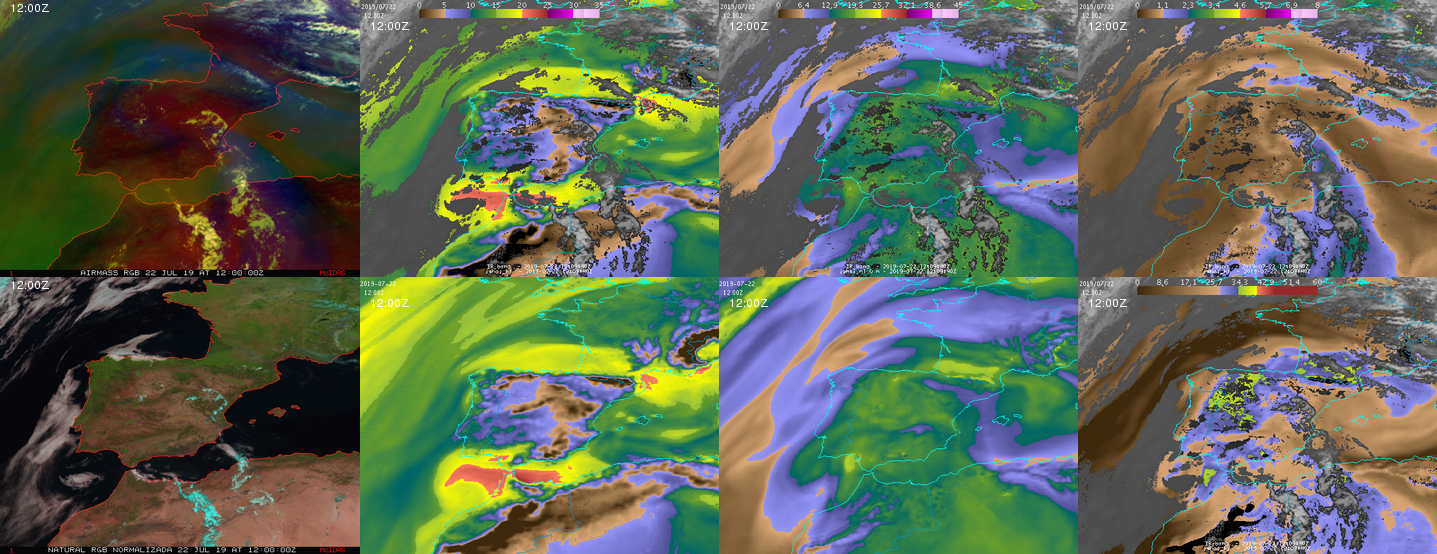
Example at 12 UTC: Loop of airmass RGB (top
left), iSHAI BL (top center left),
iSHAI ML (top
center right), iSHAI
TPW (top right), corrected
to same sun zenith angle and hour natural RGB (bottom left), ECMWF BL (bottom center left),
ECMWF ML (bottom center
right), iSHAI
K-Index (bottom
right) from 22 July 2019 produced from MSG-4.
To download the video AVI file
with the loop click use this link.
Synthetic MTG-FCI and MTG-IRS for same
case study are available in these links:
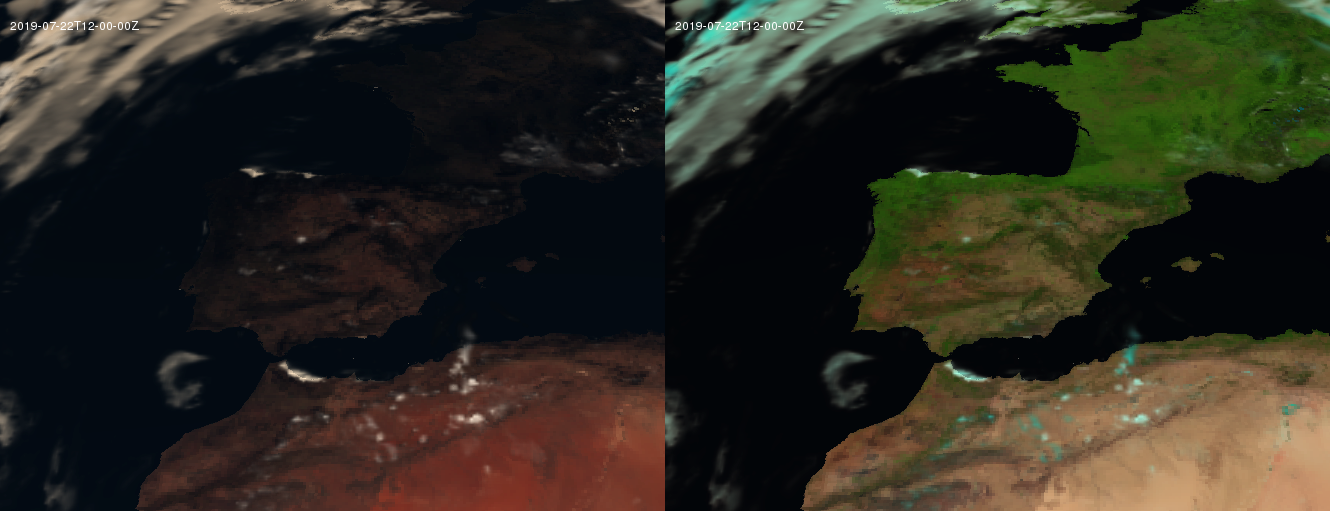
Synthetic MTG-FCI images
a) Video AVI files with synthetic MTG-FCI true
color and natural RGBs
To download the video AVI file with
the loop click use this link
b) Animated GIF with synthetic MTG-FCI VIS0.9
microns channel and the use for TPW estimation
c) Animated GIF with synthetic MTG-FCI NIR1.3
microns channel and the use for HL estimation (HL: precipitable
water in High Layer)
Synthetic IASI images as proxy of MTG-IRS L1 images
Loop of synthetic IASI BT spectra calculated with PGE00. PGE00
call RTTOV-12.1 using as input ECWMF on hybrid level for 2019-07-22
from 12:00Z to 18:00Z every 30 minutes.
The synthetic IASI BTs has been calculated with SEVIRI zenith
angles and resolution 1x1 pixels on MSG grid (3x3 km); same
spatial resolution that above MTG-FCI images.
The region used is around the region covered by a future MTG-IRS
dwell (160x160 array at 4x4 km).
As example is shown a loop of synthetic IASI BT at 695, 706, 734 and
919.5 cm-1 the wavenumbers has been selected in CO2
branch to provide top to down view in the atmosphere.