
Cloud Top Temperature and Height (GEO v2021)
Table of contents
1. Goal of CTTH product
2. CTTH algorithm summary description
3. List of inputs for CTTH
4. Coverage and resolution
5. Description of CTTH outputs
6. Example of CTTH visualisation
Access to "Algorithm Theroretical Basis Document for Cloud Products Processors of the NWC/GEO" for a more detailed description.
1. Goal of CTTH product
The cloud top temperature and height (CTTH), developed within the SAF NWC context, aims to support nowcasting applications. This product contributes to the analysis and early warning of thunderstorm development. Other applications include the cloud top height assignment for aviation forecast activities. The product may also serve as input to mesoscale models or to other SAF NWC product generation elements.
The CTTH product contains information on the cloud top temperature and height for all pixels identified as cloudy in the satellite scene.
2. CTTH algorithm summary description
The different steps of the processing, applied to cloud-classified image, are listed below. The exact process applied to each pixel depend on the availability of NWP and satellite data.
- If all mandatory NWP and satellite data are available (see list of input for CTTH):
The following process is then applied:
-
RTTOV radiative transfer model is applied using NWP temperature and humidity vertical profile to simulate 6.2µm, 7.3µm, 13.4µm, 10.8µm, and 12.0µm cloud free and overcast (clouds successively on each RTTOV vertical pressure levels) radiances and brightness temperatures. This process is performed in each segment of the image (the size of the segment is defined by the user, the default value being 4*4 satellite IR pixels). The vertical profiles used are temporally interpolated to the exact slot time using the two nearest in time NWP fields input by the user.
-
The techniques used to retrieve the cloud top pressure depend on the cloud’s type (as available in CT product):
-
For very low, low or medium thick clouds: The cloud top pressure is retrieved on a pixel basis and corresponds to the best fit between the simulated and the measured 10.8µm brightness temperatures. The simulated brightness temperature are available at the segment resolution. In case of the presence of a low level thermal inversion in the forecast NWP fields, the very low, low or medium clouds are assumed to be above the thermal inversion only if their brightness temperatures are colder than the air temperature below the thermal inversion minus an offset whose value depends on the nature of the thermal inversion (dry air above the inversion level or not).
-
For high thick clouds: a method called the radiance ratioing technique (see the next bullet for further explanation of the method) is first applied to remove any remaining semi-transparency that could have been undetected by the cloud type scheme. In case of failure, the method defined for medium opaque clouds is then applied.
-
For high semi-transparent clouds: The 10.8µm infrared brightness temperatures are contaminated by the underlying surfaces and cannot be used as for opaque cloud. A correction of semi-transparency is applied, which requires the use of two infrared channels: a window (10.8µm) and a sounding (13.4µm, 7.3µm 7.0µm or 6.2µm) channels. The basis is that a cloud has a higher impact in a window channels than in a sounding channels. The following process is implemented:
-
The H2O/IRW intercept method (as described by J.Schmetz), based on a window (10.8µm) and sounding (13.4µm, 7.3µm, 7.0µm or 6.2µm) radiance bi-dimensional histogram analysis, is first applied. The histograms are built in boxes of 32x32 satellite IR pixels centred on each segment of the image (whose size is defined by the user, the default value being 4*4 satellite IR pixels). It therefore allows the retrieval of cloud top pressure at the segment horizontal resolution (i.e., by default 4*4 satellite IR pixels). This method is successively applied using the 7.3µm, 7.0µm, 6.2µm and 13.4µm radiances, the final retrieved cloud pressure being the minimum cloud top pressures obtained using single sounding channels.
-
If no result can be obtained with the H2O/IRW intercept method, the radiance ratioing method, as described by Menzel, is then applied to the 10.8µm and 7.3µm radiances to retrieve the cloud top pressure at a pixel basis. If no result can be obtained, the method is applied to 7.0µm, 6.2µm and finally to 13.4µm radiances.
-
If the radiance ratioing technique leads to cloud top temperatures warmer than the corresponding 10.8µm brightness temperatures, the method for thick clouds is used instead.
-
-
For fractional clouds : No technique is proposed in the current version for low broken clouds. The sounding channels are nearly unaffected by broken low clouds and are therefore useless; the infrared 10.8µm and 12.0µm are contaminated by the surface and cannot be used as for opaque clouds.
-
-
A gap-filling procedure is applied in semi-transparent cloud top pressure fields: in each box of 32*32 satellite IR pixel, a cloud top pressure is computed as the average pressure of all pixels containing semi-transparent clouds inside the current and the eight surrounding boxes. This average cloud top pressure is then assigned to all pixels of the current box containing semi-transparent clouds and having no retrieved cloud top pressure.
-
Cloud top temperature and height (above sea level) are then computed from their pressure using general modules. During these processes, the atmospheric vertical profiles are temporally interpolated to the exact slot time using the two nearest in time NWP outputs fields.
-
Effective cloudiness (defined as the fraction of the field of view covered by the cloud (the cloud amount) multiplied by the cloud emissivity in the 10.8µm window channel) is also computed during the processing. It is equal to 1.0 for thick clouds and takes a value between 0.0 and 1.0 for semi-transparent clouds.
The forecast's quality may affect the result, especially for the semi-transparent clouds for which the pressure retrieval relies very much on the humidity vertical distribution and for the low clouds in case of temperature inversion.
- In case some mandatory NWP or satellite data are missing (see list of inputs for CTTH):
Cloud top temperature of very low, low, medium and high clouds are then computed by applying a climatological atmospheric absorption correction to the 10.8µm brightness temperature using look-up tables. The cloud top pressure and height are not retrieved.
Details on the methods can be found in the Algorithm Theoretical Basis Document, that can be downloaded from this web page.
3. List of inputs for CTTH
Mandatory inputs are flagged, whereas the impact of missing non-mandatory data on the processing are indicated.
Satellite Imagery
The following satellite brightness temperatures and radiances are needed at full IR spatial resolution:
| Rad6.2µm | Rad7.0µm | Rad7.3µm | Rad13.4µm | Rad10.8µm | T10.8µm | T12.0µm |
| At least one of these channels is mandatory | Mandatory | Mandatory | Mandatory | |||
The CTTH software checks the availability of satellite brightness temperatures and radiances for each pixel. Full CTTH product is computed only if all mandatory satellite radiances and brightness temperatures are available. If T10.8µm brightness temperature is missing, no result is available. If T10.8µm brightness temperature is available, but mandatory channels are missing, only the cloud top temperature is computed using the method based on climatological atmospheric absorption correction.
The satellite channels are input by the user in HRIT format, and extracted on the processed region by NWC/GEO software package.
CMA and CT cloud categories
The CMA and CT cloud categories are mandatory. They are computed by the CMA and CT software.
Satellite angles associated to satellite imagery
This information is mandatory. It is computed by the CTTH software itself, using the definition of the region and the satellite characteristics.
NWP parameters
The forecast fields of the following parameters, remapped onto satellite images, are used as input :
- surface temperature
- surface pressure
- air temperature and relative humidity (alternatively dew point temperature) at 2m
- air temperature, relative humidity and geopotential on vertical pressure levels
- tropopause temperature, pressure and geopotential
- altitude of the NWP model grid (alternatively surface geopotential on the NWP model grid). Required if NWP fields are used as input.
Vertical pressure levels on which air temperature and humidity are defined by the user. All the surface and near-surface NWP informations and at least NWP informations every 210 hPa on the vertical are mandatory to get full CTTH product. Otherwise only the cloud top temperature is retrieved using the method based on climatological atmospheric absorption correction.
These remapped fields are elaborated by the SAFNWC software package from the NWP fields input by the user in GRIB format.
RTTOV simulations
The following parameters simulated by RTTOV are used as input :
- Clear sky top of atmosphere radiance
- Transmittance from surface to TOA
- Clear sky downwelling radiance
- Clear+cloudy TOA radiance for given cloud top pressure and fraction (run RTTOV with black cloud at surface level)
- Level to space overcast radiance given black cloud for each vertical level defined by the user
These remapped fields are elaborated by the NWC/GEO software package by applying RTTOV to the NWP fields input by the user in GRIB format.
The RTTOV simulations are mandatory to get full CTTH product. Otherwise only the cloud top temperature is retrieved using the method based on climatological atmospheric absorption correction.
OSTIA fields
The following parameters simulated by RTTOV are used as input :
- OSTIA sst and local estimated error
High resolution global daily bulk SST fields (OSTIA) are input by the user who can obtain them from MyOcean service desk (see http://www.myocean.eu.org). They are used in conjunction with RTTOV simulations.
These OSTIA fields are not mandatory: if not available the RTTOV simulations will be performed using NWP skin surface temperature.
RTTOV bias file
RTTOV bias files are used as input. They can be downloaded from AEMET ftp server. They are valid only for ECMWF model.
These files are not mandatory. If not available, the bias can be computed by GEO-CTTH (the processed region needs to contain large enough area covered by oceanic surfaces). If this computation is not possible, the GEO-CTTH uses IR RTTOV simulation without bias correction.
Ancillary data sets
The following ancillary data, remapped onto satellite images, are mandatory:
- Land/sea atlas
- Elevation atlas
- Monthly minimum SST climatology
- Monthly thermal emissivity at IR wavelength
- Monthly mean 0.6µm atmospheric-corrected reflectance climatology (land)
These ancillary data are available in the NWC/GEO software package at a global scale; they are remapped on the satellite disk by NWC/GEO remapping functionality.
One coefficient's file, containing satellite-dependent values and one look-up table for climatological atmospheric absorption correction, is available in the SAFNWC software package, and is needed by the CTTH software.
4. Coverage and resolution
The CTTH software has been designed to allow the processing at satellite IR full spatial resolution of any rectangular areas defined by the user inside the satellite full disk (the processing of the full disk is also possible). The validity of the CTTH product is commited inside the satellite full disk.
5. Description of CTTH outputs
CTTH products are coded in NetCdF and includes:
- Cloud top pressure in Pa
- Cloud top altitude in m
- Cloud top temperature in K
- Effective cloudiness in %
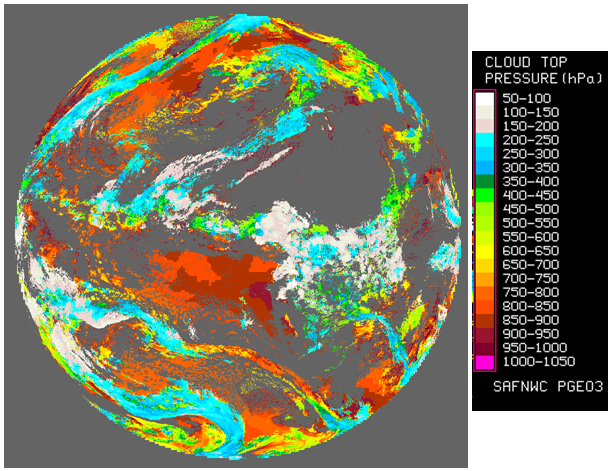
6. Example of CTTH visualisation
It is important to note that the CTTH product is not just images, but numerical data. At first hand, the CTTH is rather thought to be used digitally (together with the appended quality flags) as input to mesoscale analysis models, objective Nowcasting schemes, but also in the extraction of other SAFNWC products.
Colour palettes are included in CTTH NetCdF files, thus allowing an easy visualisation of cloud top pressure (as illustrated on the SEVIRI example), height, temperature and effective cloudiness.
The product, if used as an image on the forecaster desk, may be visualized (together with CT) in an interactive visualisation system, where individual pixel values (top temperature, height and pressure, cloudiness) may be displayed while moving the mouse over the image.
Click on thumbnail for full-sized this image
SEVIRI CTTH cloud top pressure using the colour palette included in CTTH NetCdF files.