RAPIDLY DEVELOPING THUNDERSTORM - Convection Warning (GEO v2021)
- Goal of the RDT-CW product
- RDT-CW Algorithm summary description
- List of inputs for RDT-CW and configuration parameters
- Coverage and resolution
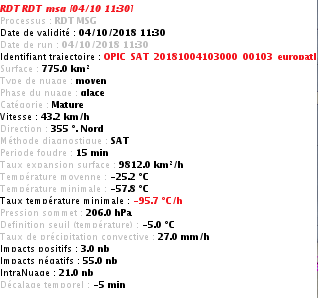
- Description of RDT-CW outputs
- Examples of RDT-CW visualization
Access to user documentation for more details on Convection Products:
- User Manual
- Algorithm Theoretical Basis Document
- Validation Report
Goal of the RDT-CW product
The RDT-CW (Rapidly Developing Thunderstorm - Convection Warning) product has been developed by Meteo-France in the framework of the EUMETSAT SAF in support to Nowcasting. Using mainly geostationnary satellite data, it provides information on clouds related to significant convective systems, from meso scale (200 to 2000 km) down to smaller scales (tenth of km).
The objectives of RDT-CW are:
- The identification, monitoring and tracking of intense convective system clouds
- The detection of rapidly developing convective cells
- The forecast of the convective cells
The object-oriented approach underlying the RDT-CW product allows to add value to the satellite image by characterizing convective, spatially consistent, entities through various parameters of interest to the forecaster such as motion vector, cooling and expansion rate, cloud top height... and their time series.
Thereby, RDT-CW is a tool for forecaster but can be used by research teams, and end-users like aeronautical users.
RDT-CW Algorithm summary description
The RDT process includes four steps:
- The detection of cloud systems
- The tracking of cloud systems
- The discrimination of convective objects
- Forecasting convective cloud systems
Additionally calculation of External attributes of convective objects and 3D description are performed
The detection of cloud systems
Prior to any analysis, RDT-CW undertakes a cloud filtering using CT product. All non-cloudy pixels are ignored through a dynamic cloud filtering. Since cloud type information is further used as attribute to cloud cell objects, CT is rather used than CMA product.
Moreover the product takes into account the deformation of pixels when on the edge of the spaceview domain. A mask of stretched pixels (pixels more than 5 * nominal_area) is automatically elaborated and backuped, and masked zones are ignored in the detection step, where gradients processing (used as predictor in discrimination scheme) should be less reliable.
The detection algorithm allows to define “cells” which represent the cloud systems as seen in the infrared 10.8 channel or equivalent.
|
CT product |
Non cloudy pixels identification |
|
stretched pixels masking (backup file) |
mask for stretched pixels |
|
stretched pixels + non cloudy pixels |
Non cloudy or stretched pixels identification |
|
IR10.8 image |
Working image for RDT-CW detection step |
Cells identification
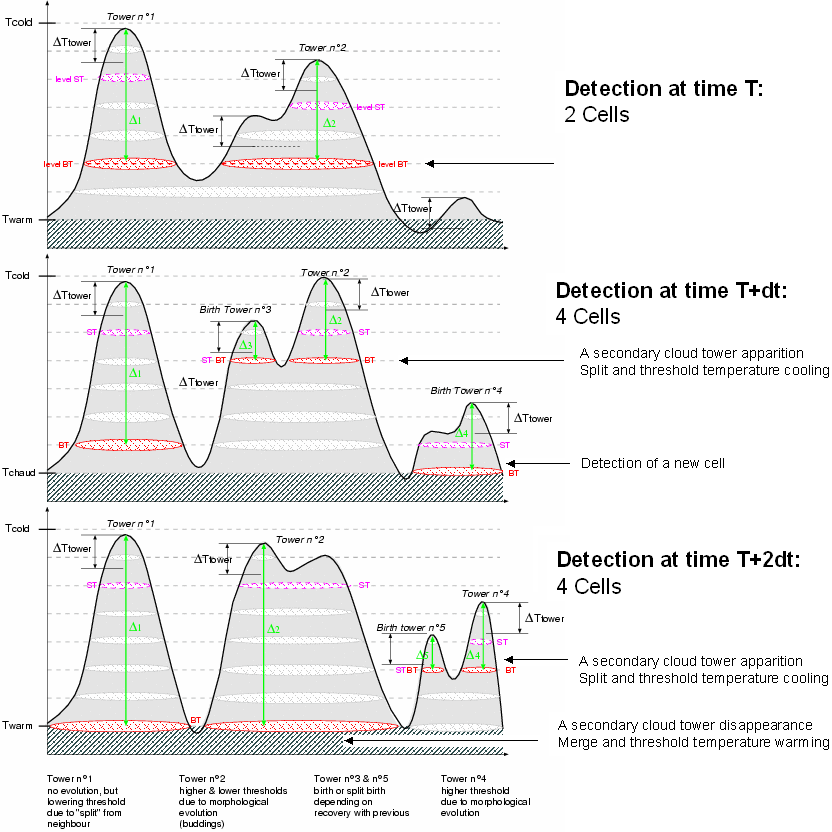
The RDT-CW detection method is based upon an adaptive temperature thresholding of infrared images. Thus, each cloud system is represented by one or several cells defined by its own, cell-specific, temperature threshold, ranged between a warm threshold and a cold threshold.
RDT-CW cells point out the bottom of cloud towers included inside cloud system. The temperature threshold used to define the bottom of an RDT-CW object is the warmest one which allows to distinguish it from others nearby temperature extremes. A limitation has been introduced regarding tropopause level (temperature) or a user-configurable temperature threshold.
Depending on cloud system morphology, some cloud cells will benefit from a second outline describing top of tower, towards a 3D description of the system (applicable for example with some large cloud systems).
The tracking of cloud systems
Once the detection of cloud systems is performed, the tracking module of the RDT-CW software is applied on the detected “cells” and allows building trajectories of cloud systems from a sequence of infrared images. The tracking algorithm is based on the geographical overlapping of “cells” between two successive infrared images. It also handles splits and merges of cloud systems.
One main input of the tracking of the cloud system is the previous moving speed estimation of cloud cells. Main results are the current moving speed estimation, and time-based links with previous cells.
For that reason RDT-CW software pre-calculates a movement guess field to consolidate this approach. A 2D movement field is estimated in optimum configuration with last available HRW wind observations. Those observations are filtered (selection of IR channels observations, using the corresponding valid pixel’s brightness temperature to keep one observation per pixel), and are remapped on the satellite grid-field region, through a weighted interpolation taking into account a radius of influence and a cut-off distance.
An additional blending with low level (700hPa) NWP wind field can be optionally processed where no information is available, but priority is given to HRW wind observations. This “guess” field allows:
- Initializing moving speed with “cold start” cases (first run), which will be useful for the next runs
- Initializing moving speed for cells with no recovery and no neighbouring cells, used for a retro-advection and checking recovery again.
For smaller cells, the use of a guess in tracking algorithm is crucial.
Motion vectors are estimated by default using displacement of weighted gravity centers positions in successive images. What's more a time-based coherence of motion vectors is undertaken to eliminate erratic estimation due to split, merge or differences in temperature thresholds.
The discrimination of convective objects
The goal of the discrimination method is to identify the convective RDT-CW objects among all cloud cells.
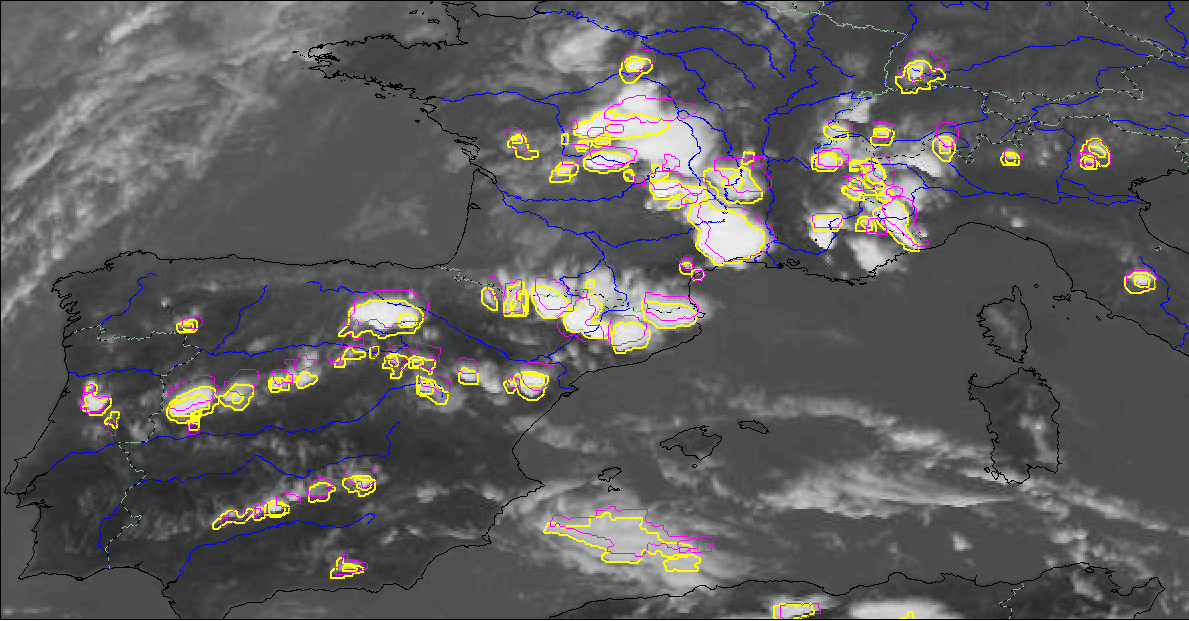
The left picture below displays all RDT-CW detected cells. It points out the detection and tracking efficiency of RDT-CW. We can notice the phenomena and scale diversity of RDT-CW objects.
The right image displays convective objects only. The ratio between no convective and convective objects is about 100.
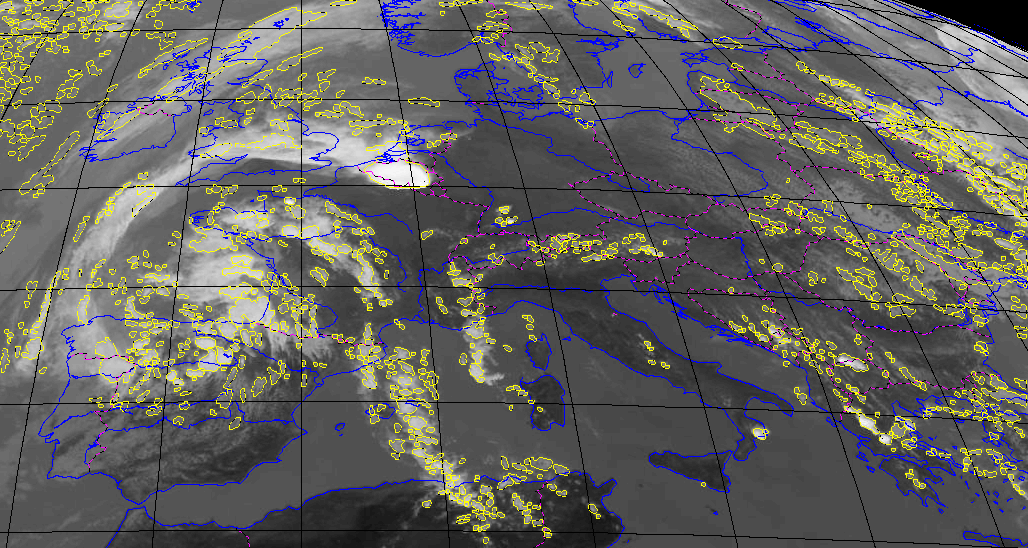
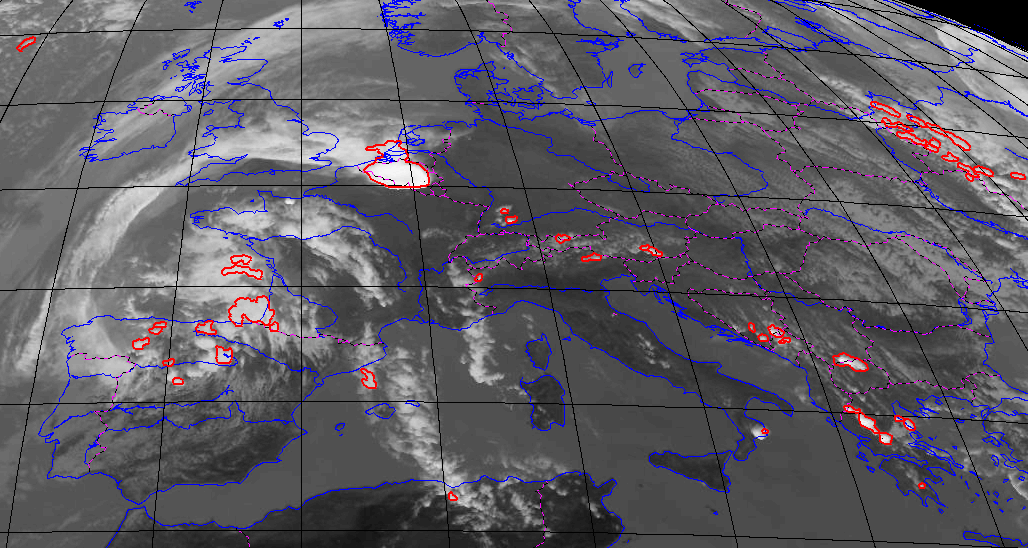
Two kinds of discrimination parameters are computed:
- Spatial characteristics (peripheral gradient, surface...)
- Temporal characteristics (rate, extremum on various past period )
The discrimination scheme is a mix between statistical models and empirical rules:
- The convective diagnosis is the result of a statistical model applied to a growing or triggering cloud system depending on its current and past parameters
- This convective characteristic is inherited as long as the cloud system is developping as expected
- Empirical rules apply after a given period, to check, confirm or declassify the convective characteristic of the cloud systems
There are now two different discrimination schemes.
- The generic discrimination (GEN). The statistical models had been tuned with SEVIRI data over France. The discrimination method makes use of discrimination parameters calculated from five channels : IR 10.8µm, IR 8.7µm, IR 12.0µm, WV 6.2µm and WV 7.3µm. Statistical models had been set up for several configurations (processing modes, vertical extension, time-based depth) on a learning database over widened France. The ground truth used for this data base was cloud to ground lightning occurrence from Meteorage network.
The discrimination scheme has then been validated over a large Europe domain using the ground truth from the extended EUCLID lightning network. - The calibrated discrimination (CAL). The discrimination method has been adapted to take into account various satellite update rates and channels availability. It has been tuned for different geostationary satellites over several months data set, using dedicated lightning network when available, and validated against independant database :
- Tuning over western Europe with MSG04 data and ground truth from Meteorage+Partners lightning network
- Tuning over western Europe with MSG03-RapidScan data and ground truth from Meteorage+Partners lightning network
- Tuning over Indian Ocean with MSG01 data and ground truth from GLD360 lightning network
- Tuning over Americas continent with GOES16 data and ground truth from GLM-GOES16 flash data
- HIMAWARI and GOES17 processes take benefit of GOES16 statistical models, because elaborated over larger dataset
When available, NWP data is used for a guidance of discrimination scheme when available:
- Convective indexes are computed from NWP to produce a convective/non convective mask to identify non convective areas
- Only cloud cells inside convective areas are submitted to discrimination scheme, to limit the number of false alarms, especially during intermediate and winter seasons
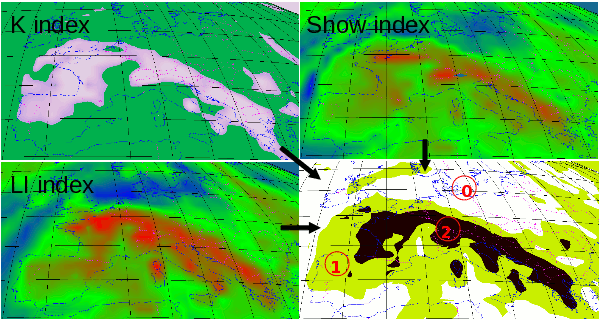
NWP mask : 0 = non convective areas = union of 3 non convective indexes
2 = convective areas = at least one index convective
The discrimination scheme is described with further details into ATBD document.
Forecasting convective cloud systems
Convective cells have their own dynamic and can have a trajectory that does not always follow the environmental displacement fields. The object mode of RDT-CW analyses the motion of each cell, and computes this speed. The forecast scheme uses this speed estimate to forecast the successive position of each cell. The Lagrangian method is proved to be quite efficient up to 1 hour range. Thus the forecast is proposed up to this limit. This leads, for MSG FDSS (15min update rate), to an independant product for each lead range (+15', +30, +45 and +60'). Corresponding products constitute the Convection-Warning part of RDT-CW.
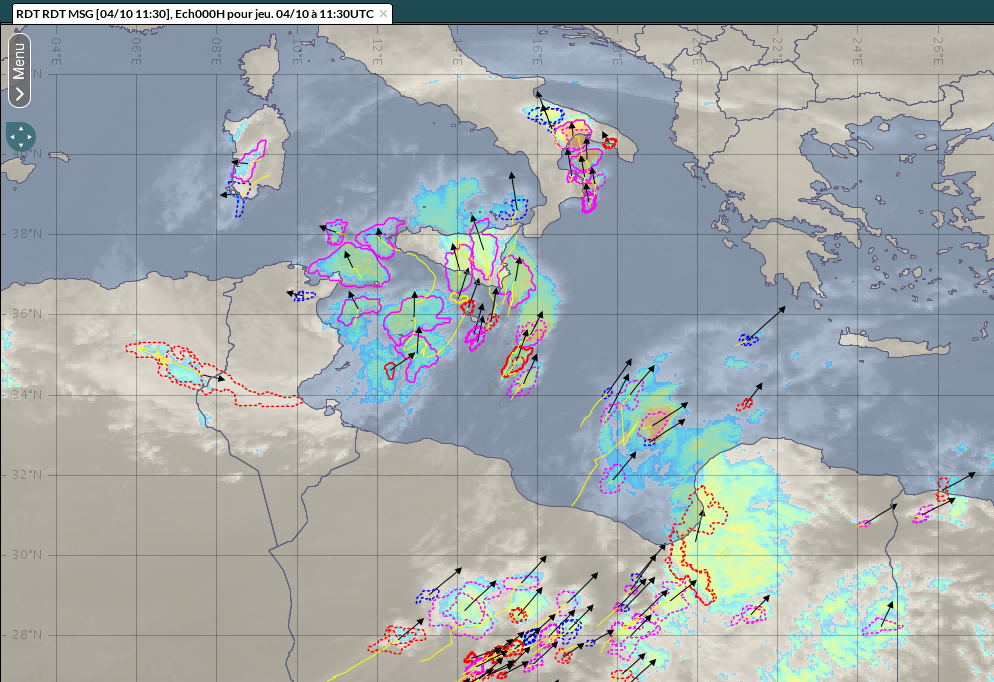
Analyzed (yellow contours) and 60min-forecast (magenta contours) RDT-CW cells
External attributes of convective objects, and 3D description
- RDT-CW is able to take into account lightning strokes location. This optional additionnal data may also allow to improve discrimination skill, if requested. The object approach of RDT-CW algorithm allows to characterize the lightning activity associated to a convective cloud object and to build its time series. It is to note that the time-based shift between satellite data and flash impact is taken into account.
- RDT-CW takes also into account a lightning trend at higher temporal resolution to approach the concept of "lightning jump", which is an interesting feature derived from total lightning activity analysis. The trend is not only evaluated between each satellite slot but also at minute scale, if the lightning data allows it.
- Flash data issued from onboard lightning sensor/imager can additionnally be taken into account. Corresponding attributes also include "lightning jump" approach
- RDT-CW can take advantage of cloud top pressure information as additional attribute, when CTTH is requested as additional optional data
- minimum value of pressure over cloud cell extension is estimated to qualify the most representative and relevant value of cloud top
- RDT-CW can take advantage of cloud type and cloud microphysics information as additional attribute, when CT and CMIC are requested as additional optional data
- Type of cloud of each pixel of cloud cell is collected and the highest proportion is estimated
- Phase information of each pixel of cloud cell is collected and the highest proportion is estimated, to qualify the cloud cell phase as water / ice / mixed
- maximum values of each COT (Cloud Optical Thickness), Reff (Effective Radius) and CWP=LWP+IWP (Cloud Water Path = Liquid Water Path + Ice Water Path) are identified when available. Those parameters may be linked to a beta-index related to High Altitude Icing Hazard
- RDT-CW can take advantage of CRRPh data as optional input, for additional attribute, when CRR is requested as additional optional data. CRR data is used to identify maximum convective rain rate over cloud cell extension.
- In case of a second outline close to top of tower; some new attributes are estimated over horizontal extension of the upper part of the cloud.
- Overshooting Top Detection (OTD) is attempted for each cloud satisfying some criteria
- Static and morphological analysis of cloud cell allows a pre-detection of OT candidates
- Relevant BT, BTD and VIS criteria, combined with NWP tropopause Temperature values allow a confirmation of the OT
- High resolution visible channel may optionnally be used to complement the detection
- They are also two synthesis attributes:
- the attribute "phase of development", ranging from "triggering" (or "split") to "growing", "mature" then "decaying" values. The attribute is a short mix of parameters linked to history, vertical extension, activity of the system
- the attribute "severity" : low, moderate, high or very high. It considers presence of overshooting top, high cooling rate, strong horizontal expansion rate, high lightning activity, occurrence of lightning jump, high values of convective rain rate, presence of high altitude ice crystals.
List of inputs for RDT-CW and configuration parameters
Input Data
SEV_BANDS channel bands to be used by PGE (HRV) VIS06 NIR16 IR38 WV62 WV73 IR87 IR108 IR120
CT 0 or 1 (default) if using CT product for additional attributes Cloud Type and Cloud Phase
CMa 0 or 1 (default) if using CT product for masking non cloud pixels
CMIC 0 or 1 (default) if using CMIC product for microphysics characteristics
CTTH 0 or 1 (default) if adding top cloud attribute via CTTH product
CRRPh 0 or 1 (default) if using CRRPh product for additional attribute
HRW 0 or 1 (default) if using HRW product as guess data for movement estimation
NWP data parameters
NWP_PARAM NWP_UW U component of wind at pressure levels specified in nwp_conf_file
NWP_PARAM NWP_VW V component of wind at pressure levels specified in nwp_conf_file
NWP_PARAM NWP_TT tropopause temperature (when available)
NWP_PARAM NWP_TP tropopause pressure (when available)
NWP_PARAM NWP_LI Lifted index (when available)
NWP_PARAM NWP_KI K index (when available)
NWP_PARAM NWP_SHW Showalter index (when available)
NWPMVTLVL Pressure level of U/V NWP data as guess data for movement estimation (default 700hPa)
Detection parameters
TCOLD cold temperature threshold when multiple thresholding, deg Celsius. Recommended temperature is -75 degC
TWARM warm temperature threshold when multiple thresholding, deg Celsius. Recommended temperature is 5degC
DELTATEMPE temperature step between Tcold and Twarm, deg, default 1
SMIN min detection area , km2, default 1. Recommended value is 60 for MSG-like resolutions, 200 for GOES-R/HIMAWARI like resolutions
SMAX max detection area , km2, default no limit. Recommended value is 400 000. It can be lowered to 200 000 when processing over small regions
Lightning data parameters
LGH 0 or N (-1 or N>0) if using lightning data for data blending and additional attribute
0: no association
-1 : association without forcing discrimination result
N (default = 1): association with impact forcing convective diagnostic from Nth impact
LGHDTANT time limit (sec) before current slot for considering lightning data (default 900 sec)
LGHDTPOST time limit (sec) after current slot for considering lightning data (default 300 sec)
LGHTLR spatial tolerance (nb of pixels - default 3) for pairing lightning stroke with cloud cell
LGHPROXI maximum distance (nb of pixels - default 50) for processing distance between lightning stroke and cloud cell
SLGH 0 or N (-1 or N>0) when using lightning data from satellite sensor
Discrimination options
NWPCONV 1(default) or 0 for limiting discrimination process to convective areas with NWP indexesAdditional options
BTLIMIT Brightness Temperature limit for the base of the tower (default -60 degC)
LIMITTROPO Flag for using NWP tropopause temperature as upper limit of threshold temperature (default 1=yes)
CANAL_UTIL Main channel used for the cell detection and tracking steps. Default is channel number 16 (IR10.8 µm channel). Recommended value for GOES-16 is channel number 15 (IR10.3 µm channel).
DBG More precise Informations on program running, default 0 (no information)
OMP_NBTHREAD Number of threads to use for parallelization, default 0 (no parallelization)
LICONV Threshold to define convective state based on Lifted Index (value below threshold). Default Threshold is -3.
LINOCONV Threshold to define stable state based on Lifted Index (value over threshold). Default Threshold is 0.
KICONV Threshold to define convective state based on K Index (value over threshold). Default Threshold is 30.
KINOCONV Threshold to define stable state based on K Index (value below threshold). Default Threshold is 20.
SHWCONV Threshold to define convective state based on Showalter Index (value below threshold). Default Threshold is -3.
SHWNOCONV Threshold to define stable state based on Showalter Index (value over threshold). Default Threshold is 3.
HR_VIS Flag for activating (1) or not (0) the management of VIS HR channels when available. Eventual use mainly for OTD. Default is 0.
Output Data
FCST Maximum range value (in minutes) for forecast products - nb of products = FCST/update rate.
Recommanded value = 60min
FCSTEP Forecast step in minutes (default identical to satellite update rate)
PARALLAX 0 or 1 (default) for activation of parallax correction
SMOOTHPTS 0 (default) or >1 for number of points taken into account for the smoothing of contours
DILAT 0 (default) or 1 for activation of dilation of cloud contour
NCMAPINCLD 0 or 1 (default): whether or not map of convective cells is included in netcdf product
INT_PRODUCT Production of the ended trajectories file (default YES)
TRAJ Format specification of the ended trajectories file when requested (for example: TISXOLH)
TRAJ_DIR Alternative directory relative to $SAFNWC/ to store CTRAJ files (default tmp/)
Coverage and resolution
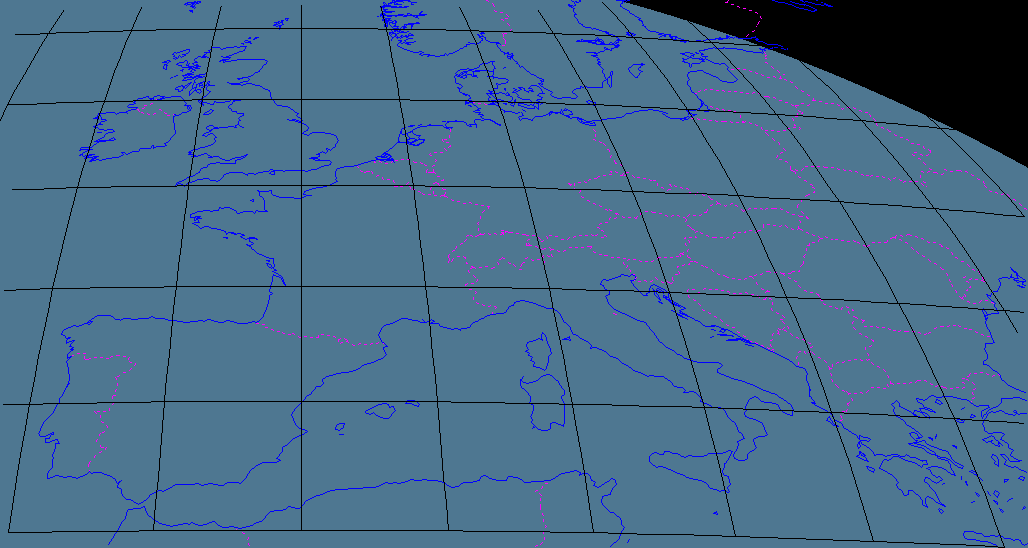
The RDT-CW software is designed to allow the processing at normal resolution of any areas defined inside or by full disk area of MSG, GOES-R or HIMAWARI-8/9 geostationary satellite families.. For example, the SAF NWC runs the RDT-CW on a MSG sub-domain centered on Europe.
Description of RDT-CW outputs
The final products concerning RDT-CW are
- Current living cloud cells: numerical data which depicts infrared characteristics (in space and time) and move information associated to RDT-CW cells. Numerical data is provided in a bulletin-like NetCDF format. Depending on user's configuration, it may also contain a map of cloud cells, whose numerical values correspond to the phase of development of each cloud system.
- Forecasted cloud cells: numerical data provided in a bulletin-like NetCDF format, focusing on localization and a limited set of attributes for a given lead time (one product for each forecast range).
- Achieved cloud trajectories: the whole life of a cloud system is described once completed, from its triggering phase to its dissipation. This information is encoded in ASCII format.
Examples of RDT-CW visualization
Access to visualization specifications for convection products on the NWC SAF (look for Code : NWC/CDOP2/GEO/MFT/SCI/RP/06).
Optimal Visualization
The RDT-CW needs development of a dedicated post-processing, depending on given specifications: access to current cell's localizations and attributes, or access to the recent current trajectories (with historical past series) from a single RDT-CW product, or to the whole trajectory through a series of RDT-CW products, the latter case implying to manage the time-based links between cloud cells.
The Current Object-Netcdf and Trajectory-ASCII formats are described in the Document Output Format (DOF) of SAFNWC. Trajectory file is produced only on user's request (see List of inputs).
Example of visualization
RDT-CW is visualized at Meteo-France on several platforms:
- Web-browser prototype for intranet / internet purposes
- SYNOPSIS: new generation Meteo-France forecaster workstation
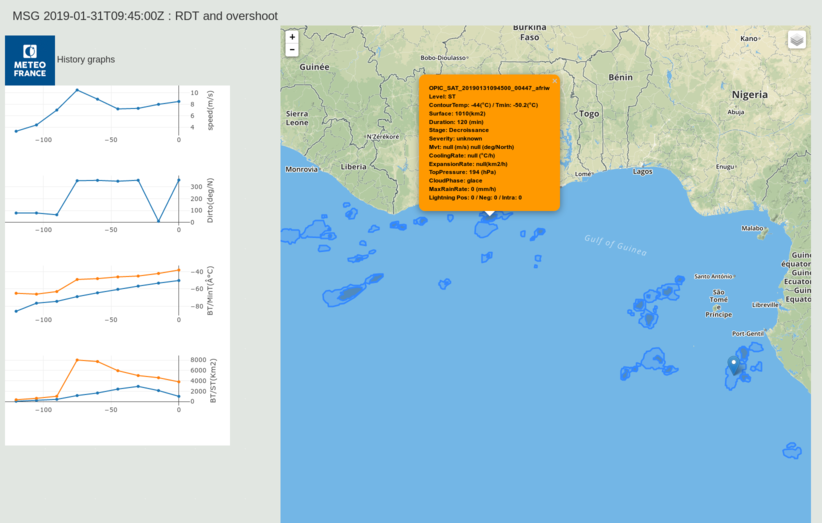
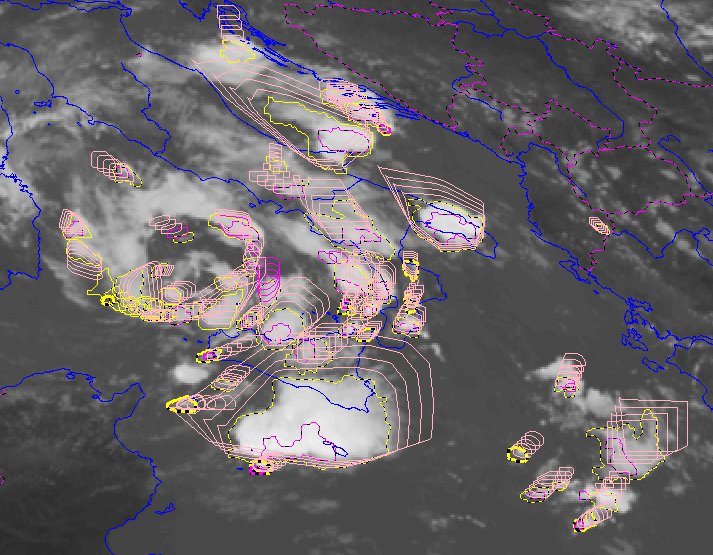
Example of product visualization with SYNOPSIS, RDT-CW cells on the left, gauge for one cell on the right (pop-up window).
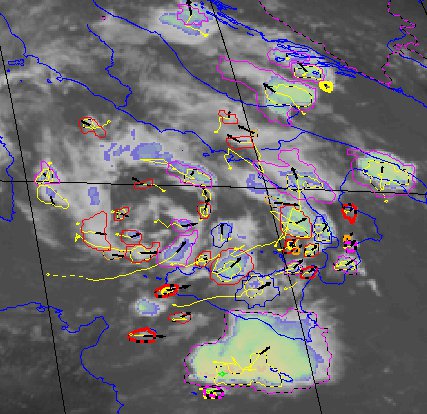
Analysed RDT-CW cells with motion vectors (left), RDT-CW +15, +30, +45 and +60 minutes smoothed and dilated forecast cells (right).
- The ACMAD (African Center of Meteorological Application for Development) offers a mirrored near real time visualization of RDT-CW products over Africa, based on Meteo-France web browser prototype visualization.