
Nigeria, 11.10.2022. Description
This Case Study was used in the course "Online training on nowcasting tools using EUMETSAT satellite products for the NMHSs in African countries"
Objective
Your are a forecaster responsible for the weather in Abuja airport (ABV). Your mission is to send warnings to the airport authorities reporting of severe weather that might lead to the decission from these authorities to close the airport. You know that during these days there is a high chance of severe convection happening at the airport. Since it is an important airport, it needs to be operative as much time as possible. Hence, you cannot make a warning for the whole day and you must do Nowcasting.
Region of Study:
Nnamdi Azikiwe International Airport, Abuja, Federal Capital Territory, Nigeria, situated 38 kilometers south west from Abuja.
Abuja is the federal capital and the forth more populated city in the country with 3 840 000 inhabitants living inside the metropolitan area in 2023.
Climatological Aspects:
Maximum average temperatures in October: 32 ºC
Minimum average temperatures in October: 21.4 ºC
Precipitation in October: 103 mm (Annual 1221.2 mm)
Rainy season cover from May to October with a maximum of rain in August (262.7 mm)
Trade winds from NE are dominant, except when the Intertropical Convergence Zone (ITCZ) moves to the north, that winds direction change to SE.
Information related to the event (from eumetsat.int website):
The rainy season in Nigeria was especially harsh in 2022, with heavy rains producing deadly, destructive floods in numerous states impacted by the worst flood in a decade.
In a period from June to late August 2022, flooding had already affected populations in several states including Lagos, Anambra, Federal Capital Territory, Borno, Ebonyi, River State, Bauchi and Benue.
During September, heavy rain, rising rivers and dam releases worsened an already dire flood situation in Nigeria.
In October, flooding in the country’s south submerged homes and farmland, and displaced hundreds of thousands of people. After prolonged and intense rains, widespread flooding affected 27 out of the 36 Nigerian states, inundating houses and streets. Transport was affected for at least two weeks, and food and fuel supplies blocked. More than 500 casualties were reported.
During the day there was convective cells triggered around the country starting at the east, moving to the west, affecting our study zone at midday.
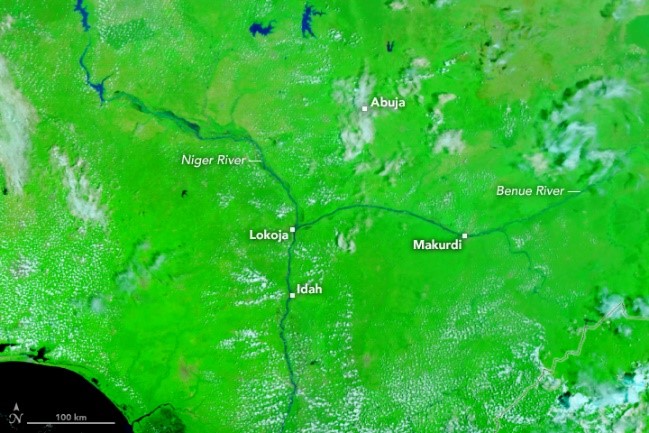
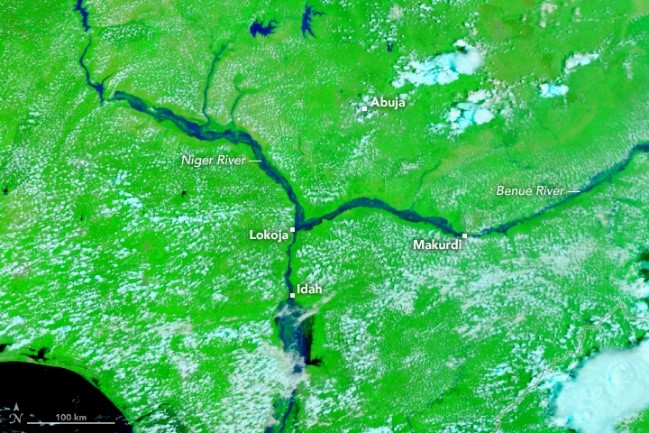
This false-colour image (right) shows flooding along the Benue and Niger rivers on October 11, 2022. For comparison, the other image (left) shows the same area on October 24, 2021, during more typical conditions. (Images from https://earthobservatory.nasa.gov)
ECMWF model
(ECMWF variables from 20220118 at 0000Z, every two hours between 06Z and 24Z)
Please use these ECMWF variables for a preliminary analysis of the situation, to be later updated with NWCSAF products. Take special interest on:
- Which air masses are involved in the situation,
and how they evolve throughout the day?
- What is the prognosis of convection with these elements?
Which are the main ingredients for this convection?
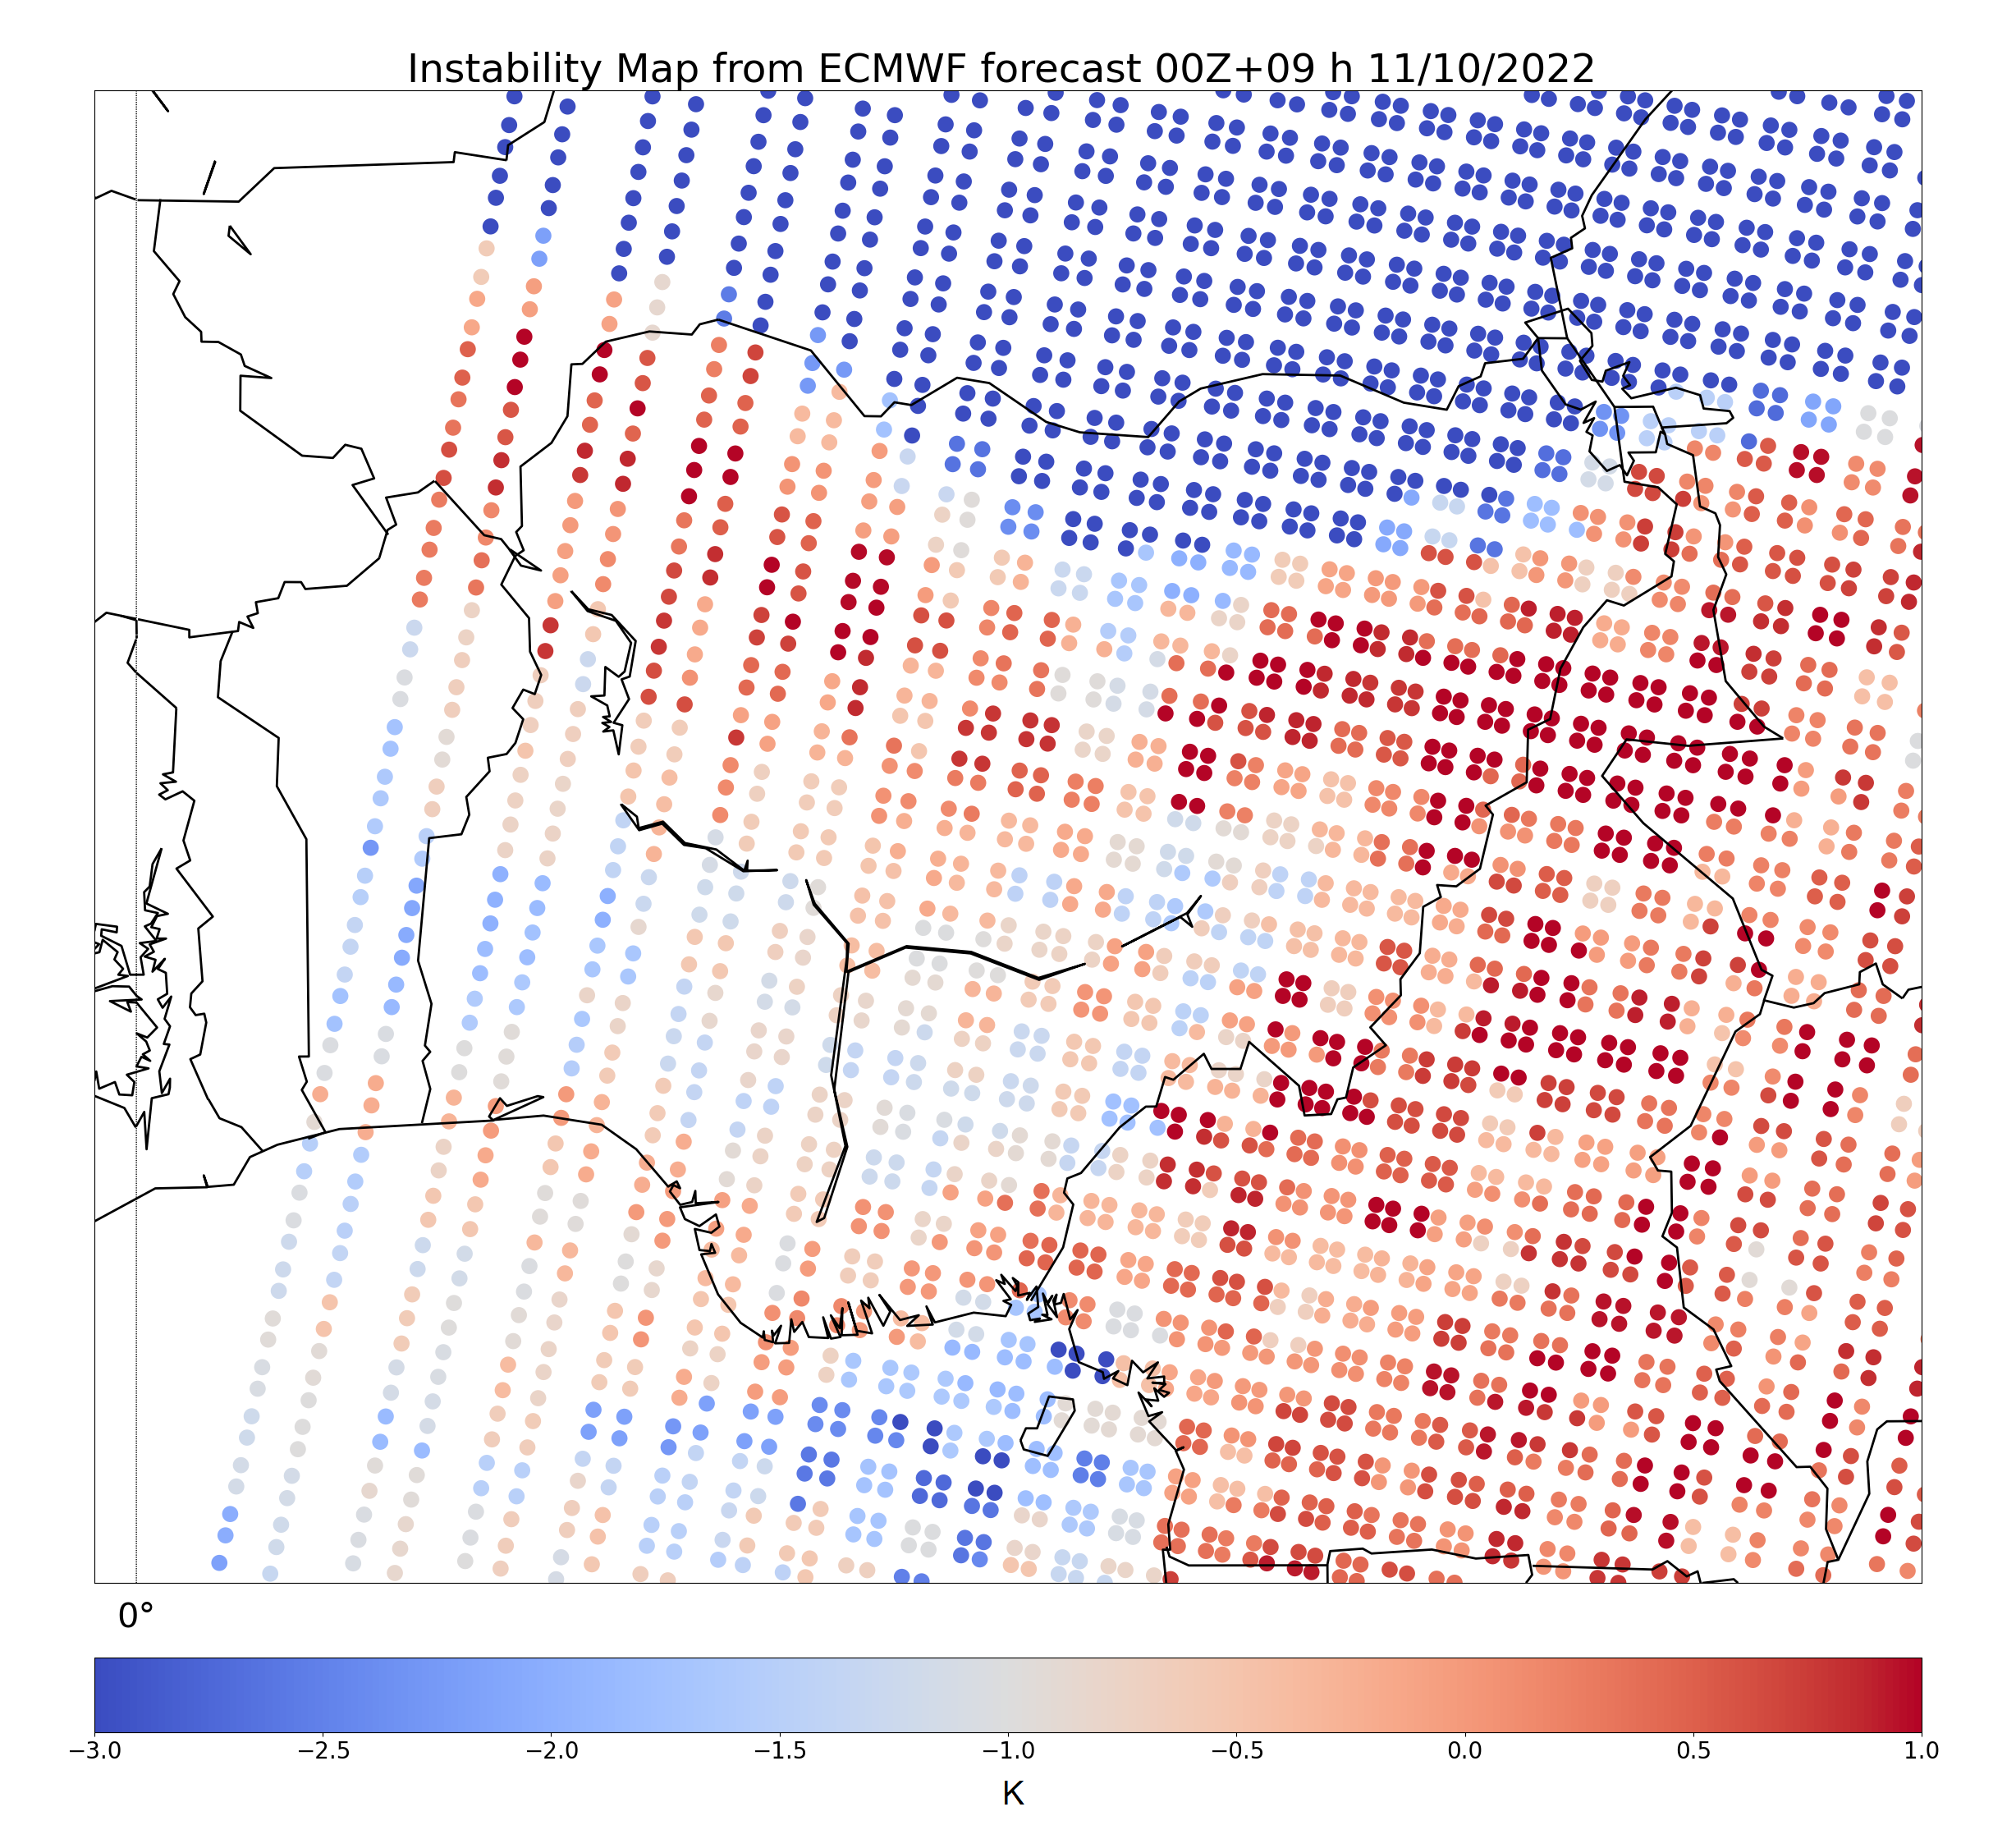
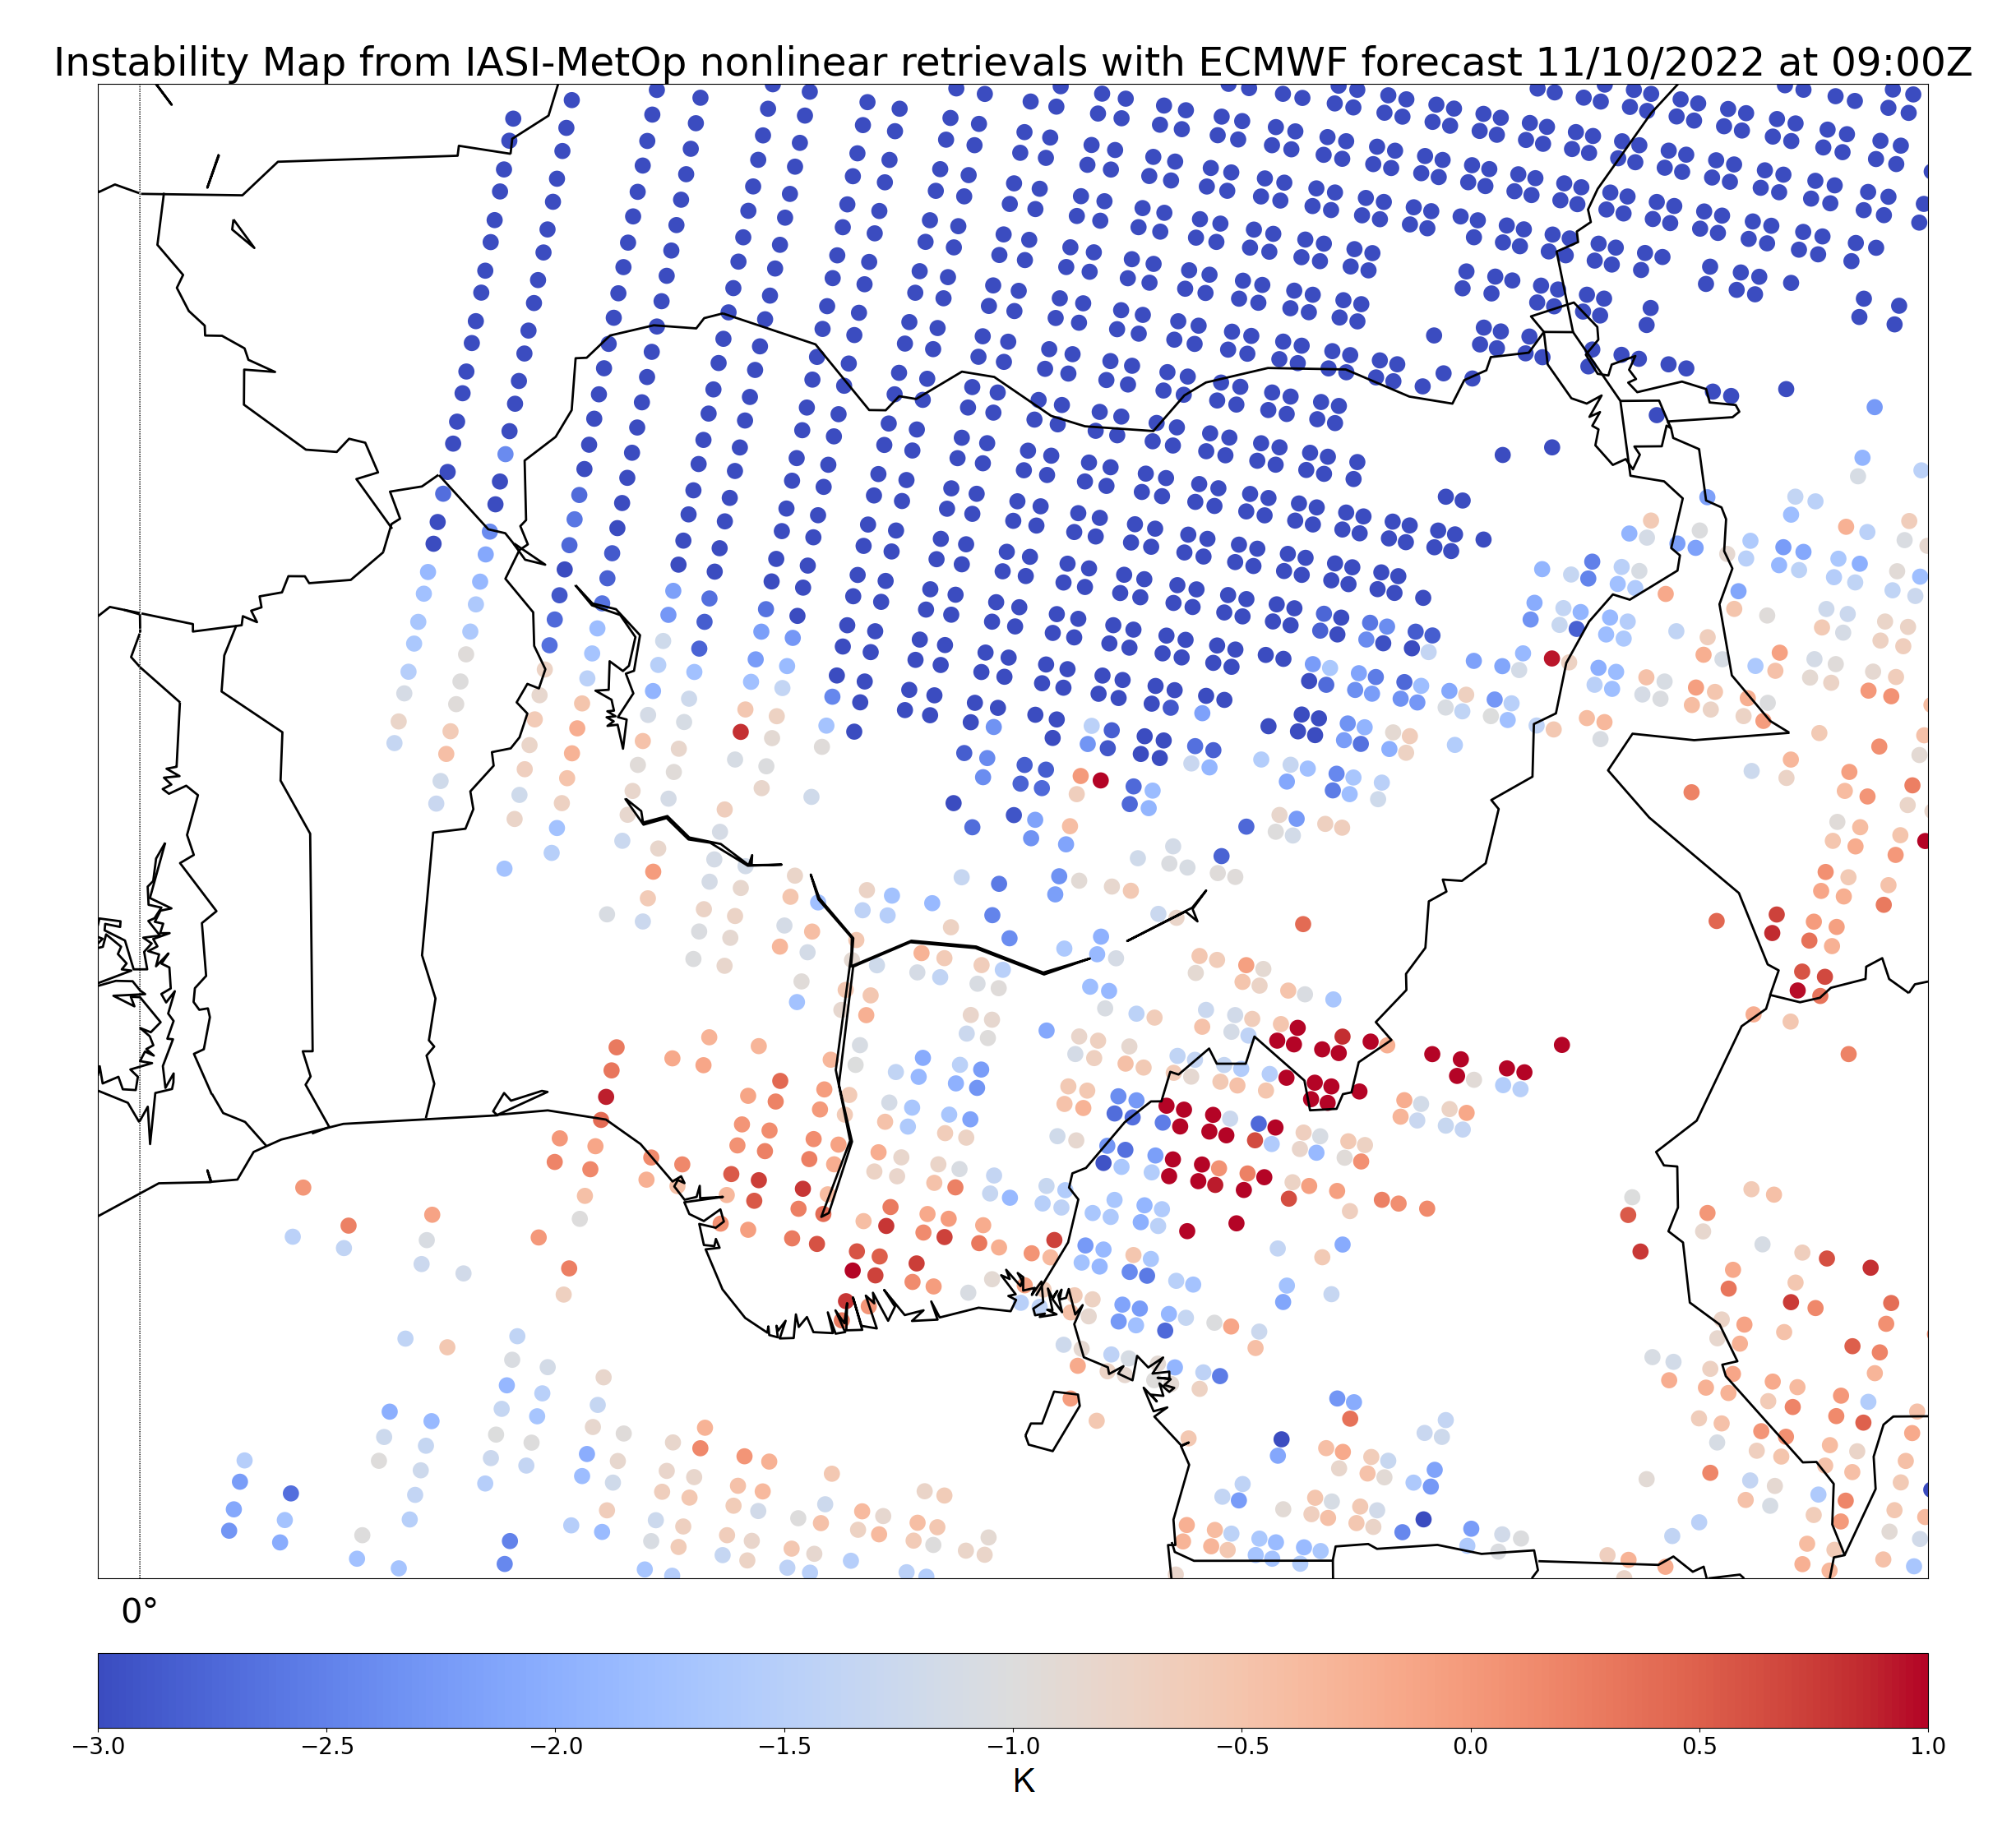
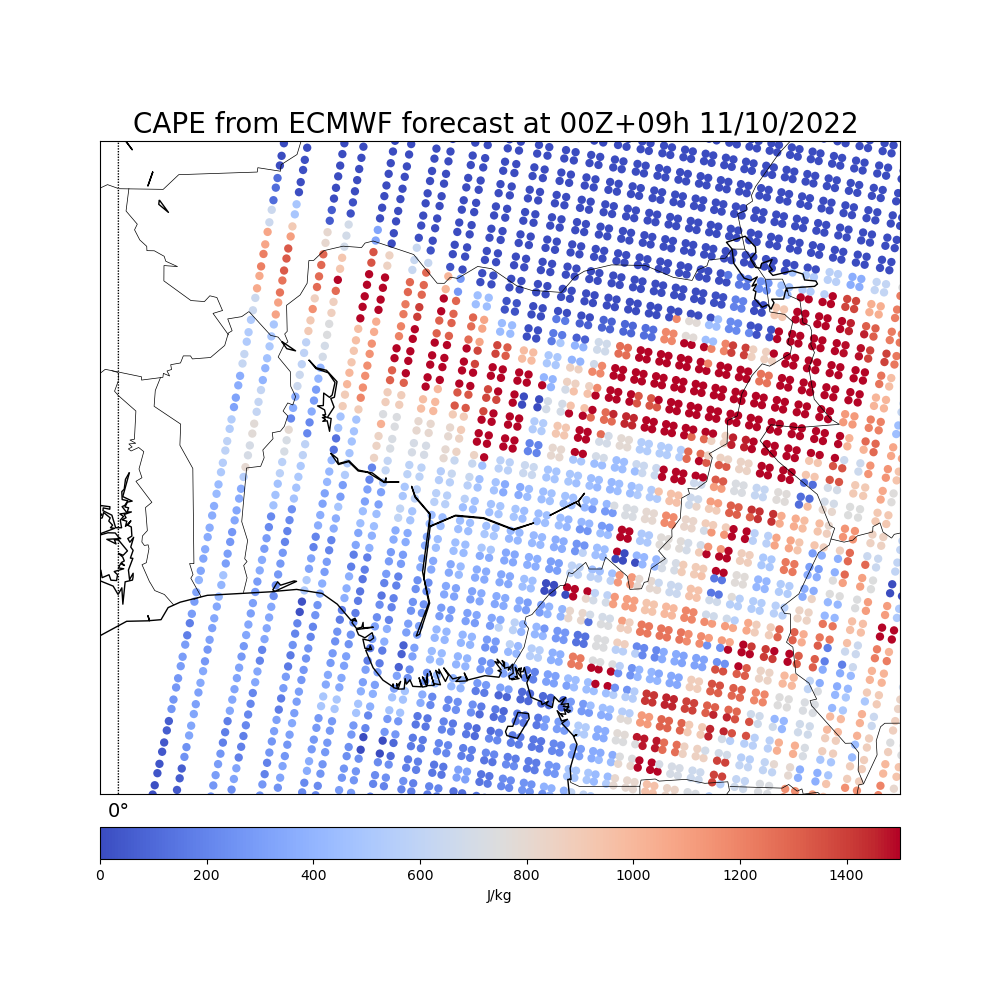
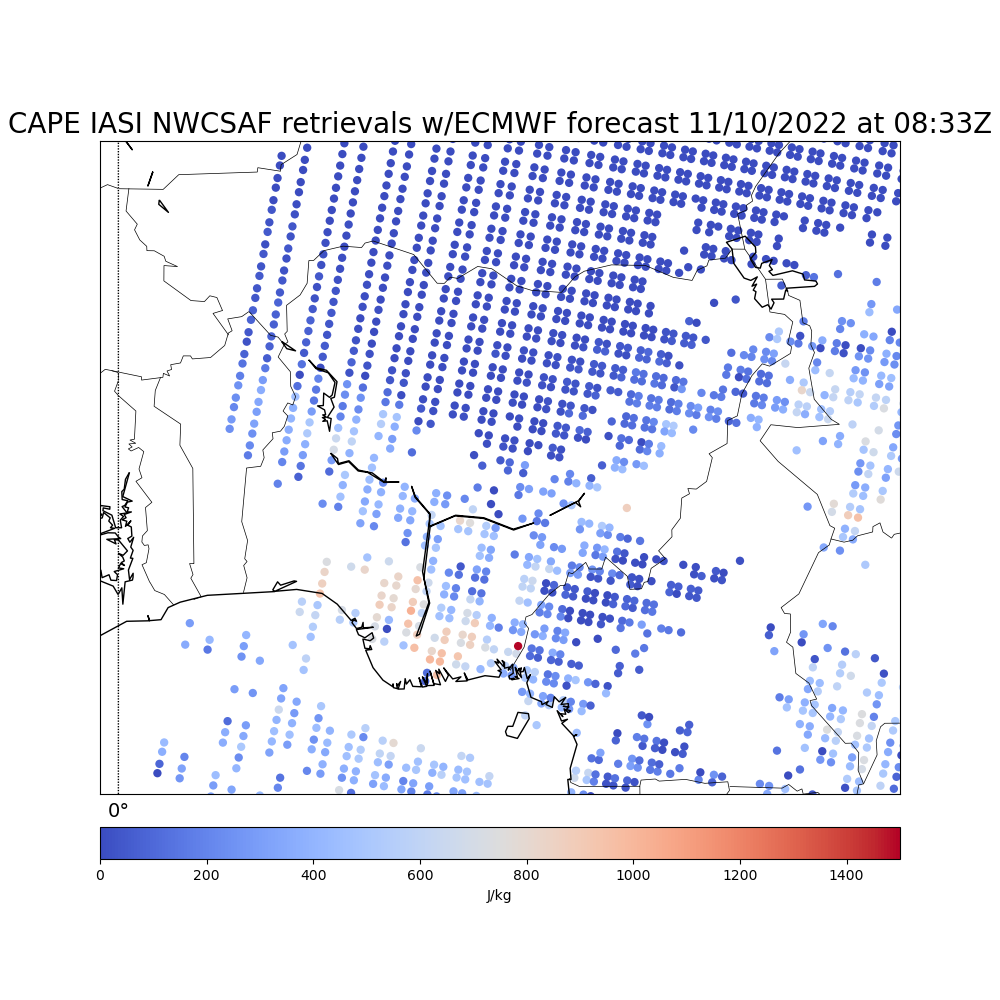
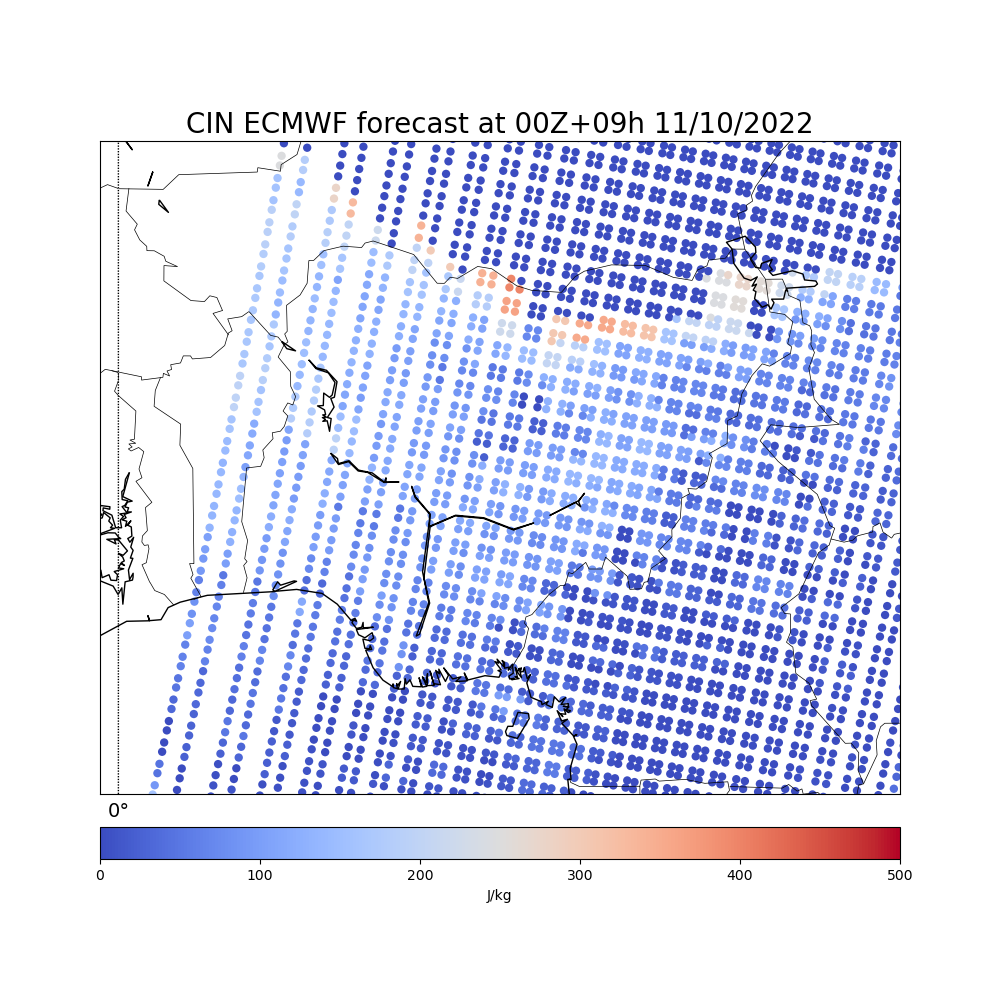
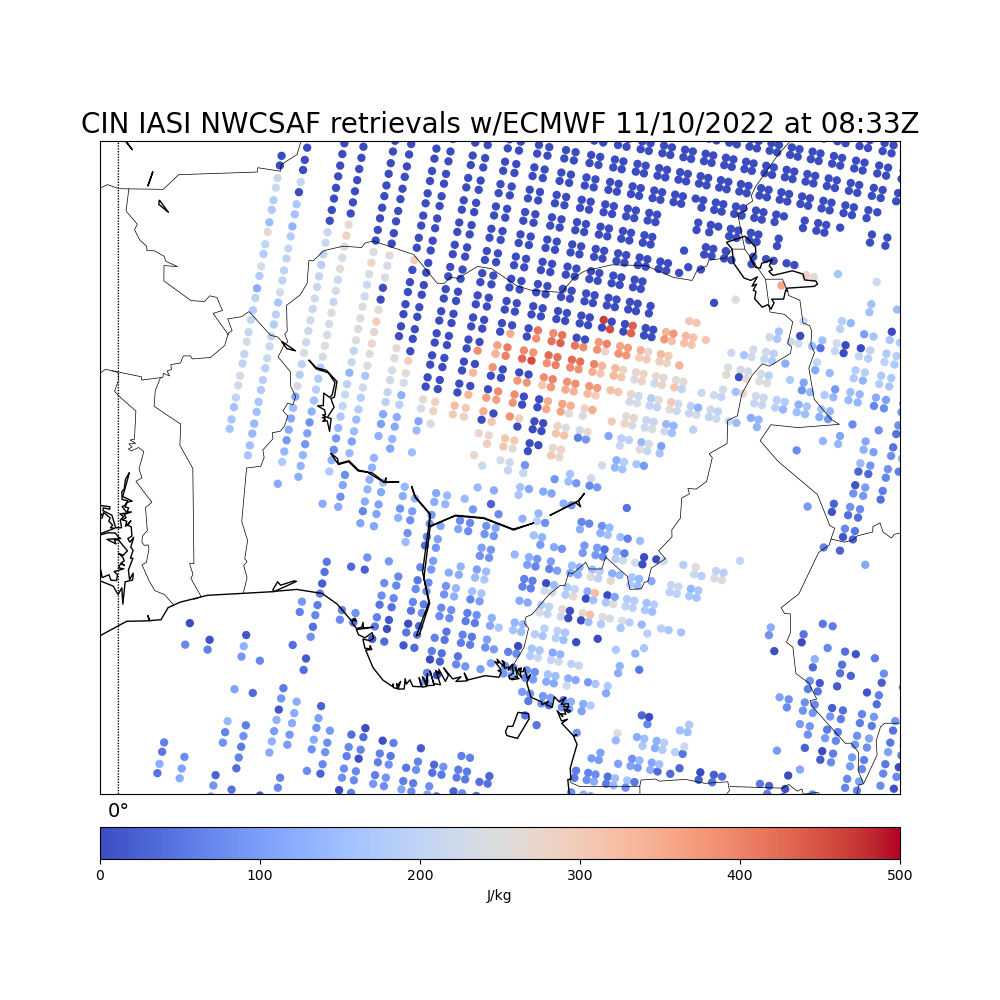
Instability Images
One image from IASI at 07Z, similar to the coming MTG-S/IRS product, compared with equivalent ECMWF forecast fields.
• From ECMWF • From IASI (as proxy for MTG-IRS)
-CAPE index
• From ECMWF • From IASI (as proxy for MTG-IRS)
-CIN index
• From ECMWF • From IASI (as proxy for MTG-IRS)
Satellite Images
IR120 images Loop (whole day 20220118, every 15 minutes)
WV062 images Loop (whole day 20220118, every 15 minutes)
NWC SAF Products
(whole day 20220118, every 15 minutes).
Update your initial prognosis with the use of the NWCSAF products!
As you have the whole loop of images, please try to evaluate in the initial images of each loop how the situation is evolving, and confirm with the later images that the expected events are actually occurring.
To evaluate convection:
- In a first wave (before convection starts), consider iSHAI products:
Clear air Humidity (tpw / bl / ml / hl) and instability (ki / li / shw) and corresponding differences of these satellite observations with ECMWF forecast humidity (difftpw / diffbl / diffml / diffhl) and instability (diffki / diffli / diffshw).
- In a second wave, when convection starts, evaluate how Clouds evolve (with CT and CTTH products) and Convection evolves (CI and RDT products)
- Evaluate also the behaviour of precipitation (with older CRR product and newer CRRPh product)
- Evaluate also the dynamics with HRW wind product.
CT Loop (Cloud Type)
CTTH Loop (Cloud Top Temperature and Height)
HRW Loop (High Resolution Winds)
RDT Loop (Rapid Developing Thunderstorms)
CI Loop (Convection Initiation)
iSHAI bl Loop (Satellite Humidity and Instability index - Boundary Layer)
iSHAI ml Loop (Satellite Humidity and Instability index - Medium Layer)
iSHAI hl Loop (Satellite Humidity and Instability index - High Layer)
iSHAI tpw Loop (Satellite Humidity and Instability index - Total Precipitable Water)
iSHAI diffbl Loop (Satellite Humidity and Instability index - Boundary Layer, difference with model)
iSHAI diffml Loop (Satellite Humidity and Instability index - Medium Layer, difference with model)
iSHAI diffhl Loop (Satellite Humidity and Instability index - High Layer, difference with model)
iSHAI difftpw Loop (Satellite Humidity and Instability index - Total Precipitable Water, difference with model)
iSHAI li Loop (Satellite Humidity and Instability index - Lifted Index)
iSHAI ki Loop (Satellite Humidity and Instability index - K Index)
iSHAI shw Loop (Satellite Humidity and Instability index - Showalter Index)
iSHAI diffli Loop (Satellite Humidity and Instability index - Lifted Index, difference with model)
iSHAI diffki Loop (Satellite Humidity and Instability index - K Index, difference with model)
iSHAI diffshw Loop (Satellite Humidity and Instability index - Showalter Index, difference with model)
CRR Loop (Convective Rainfal Rate)
CRRPh Loop (Convective Rainfal Rate, physical retrieval)
EXIM-CT Loop (Extrapolated Imagery, CT, 60 min)
Solution